Search Header Logo
Summarize Numerical Data Sets

Summarize Numerical Data Sets

Assessment

Presentation

Mathematics

6th - 8th Grade

Hard

Created by

Joseph Anderson

FREE Resource

21 Slides • 21 Questions

1

Summarizing Data

Slide image

2

Lesson Goals

  • Relate the measure of center or variablility to the shape of the data distribution.

  • Summarize a numerical data set, how it was measured and units of measure.

  • Summarize numerical data sets by reporting the number of observations.

  • Analyze data represented on a histogram.

    Interpret data on a line plot.

    Determine the interquartile range of a numerical data set.

3

Standards

  • 6.DS.4 Summarize numerical data sets in relation to their context in multiple ways

  • 6.DS.2 Select, create, and interpret graphical representations of numerical data, including line plots, histograms, and box plots.

4

Unit 6 Test Review!

  • There are 2 parts to the Test!

  • Make sure to do them both!

5

Multiple Choice

Question image

Is the mean to the left of the median in this chart?

1

Yes

2

No

6

Multiple Choice

Question image

What is the MEDIAN of this data

1

95

2

90

3

100

4

40

7

Choosing a Measure of Center

  • The mean and median are both measures of center.

  • When a distribution is normal or uniform the mean and median are equal (+/-) and represent the data accurately.

  • If the data is skewed left or skewed right the mean is skewed away from the center, so the median is a better measure of center.

8

Mean or median?

  • Which measure of center best represents the middle of the set of data?

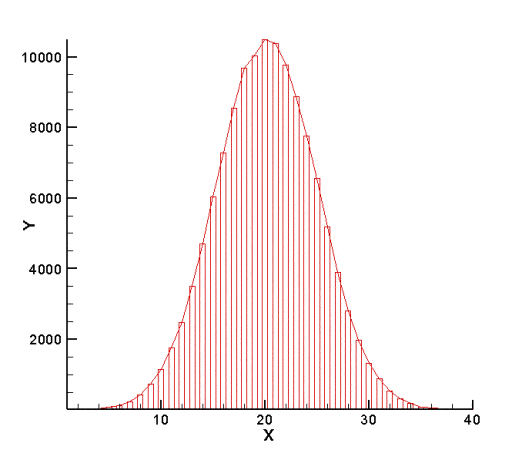
  • This histogram is very close to symmetrical (normal, regular)

  • The mean and median are close enough that either will work as a representation of the middle of the data set.

Slide image

9

Mean or Median?

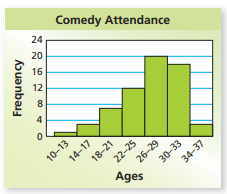
  • What is the type of distribution? The data is stretched to the right (right tailed) so it is skewed right.

  • Compare the mean and median. When a distribution is skewed right the mean is greater than the median.

  • Because the mean is pulled to the right the median is a better measure of center.

Slide image

10

Mean or Median?

  • What type of distribution?

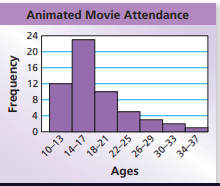
  • Though the heights are different neither end seems much taller or shorter. This is a uniform distribution

  • It is fair to assume that the mean and median are approximately equal.

Slide image

11

12

Multiple Choice

Question image

What is the shape of the data?

1

symmetrical

2

skewed left

3

skewed right

4

bell curve

13

Multiple Choice

Question image

How would you describe this distribution?

1

Left skewed

2

Uniform

3

Right Skewed

4

Symmetrical

14

Multiple Choice

Question image

What is the best measure of center for this set of data?

1

mean

2

median

3

either

15

Multiple Choice

Question image

What is the best representation of the center of the data

1

mean

2

median

3

Either

16

Multiple Choice

Question image

What is the best representation of the center of the data

1

mean

2

median

3

Either

17

Data Values

  • Each x is a single data value

  • The number the x is above is the value of that x.

Slide image

18

Fill in the Blank

Type answer...

19

5 Number Summary

  • The 5 number summary includes the minimum, Q1, the median (Q2), Q3, and the maximum.

  • Determine the minimum and maximum, then find the median (Q2), the median of the first haf of the data,(Q1) then the median of the second half of the data(Q3)

20

Fill in the Blank

Type answer...

21

Fill in the Blank

Type answer...

22

Fill in the Blank

Type answer...

23

Multiple Choice

Question image

What is the 5 number summary of this data set?

1

0, 2, 4, 5.5, 14

2

0, 1, 2.5, 9, 14

3

0, 1, 3.5, 6, 14

4

0, 1, 3, 6, 10

24

Mean

  • The mean is also know as the average.

  • To find the mean add together all of the data points and divide the sum by how many data points there are in the set.

  •  1+2+3+4+55=155=3, 3 is the mean or average\frac{1+2+3+4+5}{5}=\frac{15}{5}=3,\ 3\ is\ the\ mean\ or\ average  

25

Multiple Choice

Question image

What is the mean of this data set?

1

4.25

2

3.5

3

5

4

85

26

Range

  • Range is found by subtracting the minimum from the maximum.

  • So in a data set that looks like this: {23, 34, 45, 56, 78} you would subtract 23 from 78 (78 - 23)

  • The range of the data is 55 (78-23 = 55)

27

Fill in the Blank

Type answer...

28

Interquartile Range (IQR)

  • Interquartile range (IQR) is the middle 50% of a data set.

  • IQR is found by subtracting Q1 from Q3

  • Q1 and Q3 of this set are in red (the median is in blue) {3,4,5,6,7,8,9}

  • The IQR is found by 8-4

  • The interquartile range is 4

29

30

Fill in the Blank

Type answer...

31

Outliers

  • An outlier is a data point that is WAY outside of most of the data.

  • To find any technical outliers we need to first find the upper and lower fence.

  • Lower fence is Q11.5(IQR)Q_1-1.5\left(IQR\right)  

  • Upper Fence is  Q3 + 1.5(IQR)Q_{3\ }+\ 1.5\left(IQR\right)  

  • Any data outside of the fences is an outlier. 

32

Multiple Choice

Question image

Are there any outliers this data set?

1

Yes

2

No

33

Open Ended

Question image

What are the lower and upper fences?

34

Open Ended

What was the outlier?

35

Multiple Choice

Question image

Which choice is the best description of the distribution data set?

1

Uniform

2

Symmetrical

3

Skewed left

4

Skewed right

36

Multiple Choice

Question image

What is the best measure of center for this data set?

1

mean

2

mode

3

median

37

MAD Mean Absolute Deviation

  • MAD shows the average difference the data set has from the mean or how far on average the data deviates from the mean.

  • To find it, first find the mean.

  • Then, find the absolute distance each data point has from the mean.

  • Finally, find the mean of those absolute values.

38

MAD Mean Absolute Deviation

  • {3,4,5,6,7,8,9}

  • To find it, first find the mean.  3+4+5+6+7+8+96=427=6\frac{3+4+5+6+7+8+9}{6}=\frac{42}{7}=6  

  • Then, find the absolute distance each data point has from the mean. The absolute value of (3-6, 4-6, 5-6, 6-6, 7-6, 8-6, 9-6) or (3, 2, 1, 0, 2, 3)

  • Finally, find the mean of those absolute values. 3+2+1+0+1+2+36=122=2\frac{3+2+1+0+1+2+3}{6}=\frac{12}{2}=2  

39

40

Fill in the Blank

Type answer...

41

Make Sure:

  • You've completed all of you quizzes! (Especially 6.11!)

  • To do the test once now! (Part 1 and Part 2)

42

Questions?

Summarizing Data

Slide image

Show answer

Auto Play

Slide 1 / 42

SLIDE