
Velocity Time
Presentation
•
Physics
•
9th - 12th Grade
•
Hard

Joseph Anderson
FREE Resource
10 Slides • 10 Questions
1

2

3

4

5

6

7
Multiple Choice
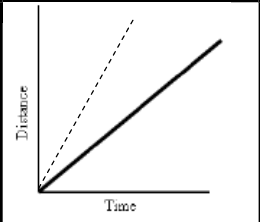
What does this graph represent?
8

9

10

11

12
Multiple Choice

What is happening to the car between 3-8 seconds?
13
Multiple Choice
14
Multiple Choice

Which section of the graph shows decreasing velocity?
15
Multiple Choice

Which section of the graph shows increasing velocity?
16
Multiple Choice

Which section of the graph shows deceleration?
17
Multiple Choice

Which section of the graph shows acceleration?
18
Multiple Choice
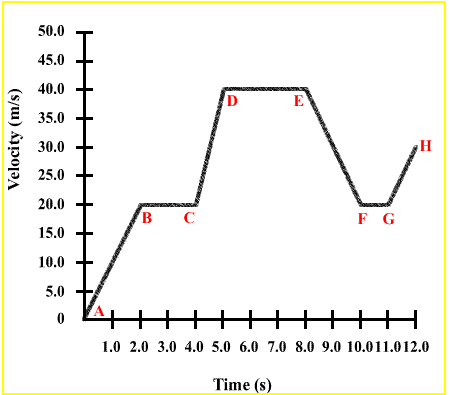
Which section of the graph shows constant velocity?
19
Multiple Choice

Calculate the displacement traveled in section D. Hint: Remember the area under a v-t graph = displacement!
20
Multiple Choice
Calculate the displacement traveled in section A. Hint: Remember the area under a v-t graph = displacement!
Show answer
Auto Play
Slide 1 / 20
SLIDE
