
Venn and Tree Diagrams
Presentation
•
Mathematics
•
8th - 10th Grade
•
Hard

Joseph Anderson
FREE Resource
10 Slides • 19 Questions
1
Probability

2
Tree diagrams
With replacement

3
Finding probability
Remember to multiply as you walk along the branches of the tree diagram

4
Multiple Choice
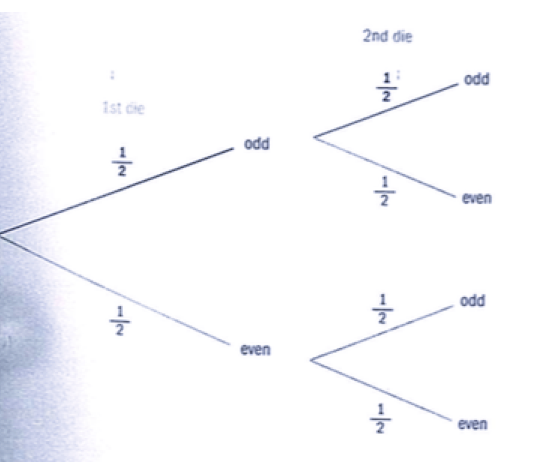
Two dice are rolled and it is recorded whether the result on each is odd or even. What is the probability both are odd?
5
Multiple Choice

What is the chance that the dessert is not brownies and does not have peanut butter in it?
6
Multiple Choice

What is the probability the dessert has peanut butter in it?
7
Multiple Choice

8
Multiple Choice

Use the tree diagram to find the probability of tossing a head first and then a tail when a coin is tossed twice.
9
Tree diagrams
Without replacement

10
Multiple Choice

There are 10 counters in a bag, 3 red and 7 blue.
I take one counter, then another without replacement.
Find the probability of the value marked x
11
Multiple Choice
There are 10 counters in a bag, 3 red and 7 blue.
I take one counter, then another without replacement.
Find the probability of the value marked y
12
Multiple Choice

There are 10 counters in a bag, 3 red and 7 blue.
I take one counter, then another without replacement.
Find the probability of picking one of each colour counters.
13
Venn diagrams

14
Venn diagrams

15
16

17
Number of
elements

18
3 Set Venn diagrams

19
Multiple Choice

The venn diagram shows which sports are played by a class of students.
How many students are in the class?
20
Multiple Choice
The venn diagram shows which sports are played by a class of students.
What is the probability of a student playing both tennis soccer?
21
Multiple Choice
The venn diagram shows which sports are played by a class of students.
What is the probability of a student playing tennis or soccer?
22
Multiple Choice
The venn diagram shows which sports are played by a class of students.
What is the probability of a student playing neither tennis nor soccer?
23
Multiple Choice

The venn diagram shows the number of people in a group of friends who have brown hair and green eyes.
How many friends are in the group?
24
Multiple Choice
The venn diagram shows the number of people in a group of friends who have brown hair and green eyes.
What is the probability of a friend having brown hair?
25
Multiple Choice
The venn diagram shows the number of people in a group of friends who have brown hair and green eyes.
What is the probability of a friend having neither brown hair nor green eyes?
26
Multiple Choice

The venn diagram shows the number of students in chorus, band, and/or orchestra.
What is the probability that a student is in both chorus and band?
27
Multiple Choice
The venn diagram shows the number of students in chorus, band, and/or orchestra.
How many students are in chorus, band, and orchestra?
28
Multiple Choice
The venn diagram shows the number of students in chorus, band, and/or orchestra.
How many students are in the orchestra?
29
Multiple Choice
The venn diagram shows the number of students in chorus, band, and/or orchestra.
What is the probability that a student is in the chorus but not the orchestra?
Probability
Show answer
Auto Play
Slide 1 / 29
SLIDE
