

10-7: Interpret Graphical Displays

Presentation
•
Mathematics
•
6th Grade
•
Practice Problem
•
Easy

Diana Garcia
Used 1+ times
FREE Resource
24 Slides • 11 Questions
1

2

3

4

5

6

7

8

9

10

11
Open Ended

What do you notice about the dot plot? Symmetrical? Not Symmetrical? outliers?
12
Multiple Choice

The results of a class survey about the number of hours they spent on the internet each week by students are shown in the dot plot. What is the best measure of center?
13
Multiple Choice

What would be the appropriate measure of variability to describe the data?
14

15

16

17

18

19

20
Multiple Choice

Is the distribution symmetric?
21
Multiple Choice
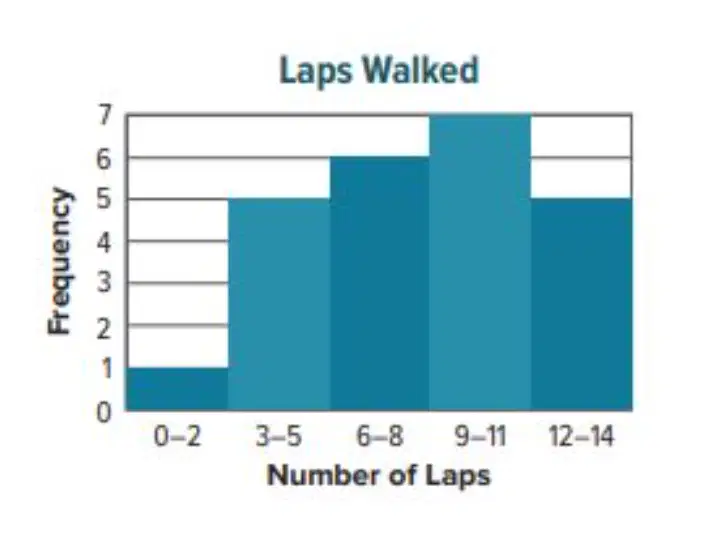
Does the distribution contain outliers?
22

23
Multiple Choice

Does the distribution have peaks? if so where?
24

25

26
Multiple Choice
27

28

29

30

31
Multiple Choice

Is the distribution symmetric?
32
Multiple Choice

Does the distribution contain outliers?
33
Multiple Choice
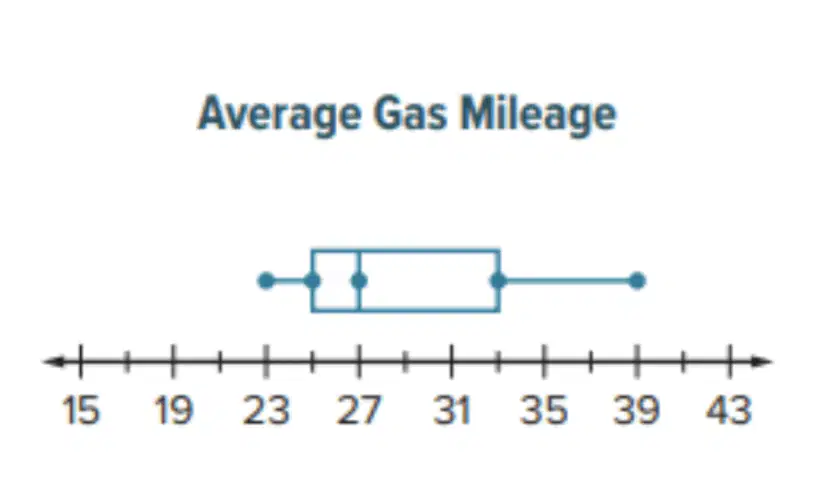
What is the median?
34
Multiple Choice

What is the IQR? (remember IQR=Q3-Q1)
35

Show answer
Auto Play
Slide 1 / 35
SLIDE


