- Resource Library
- Math
- Probability And Statistics
- Statistical Questions
- Statistical Questions And Dot Plots

Statistical Questions and Dot Plots
Presentation
•
Mathematics
•
6th Grade
•
Medium
+4
Standards-aligned

BRANDON CRUSSEL
Used 66+ times
FREE Resource
9 Slides • 21 Questions
1
Statistical Questions and Dot Plots
Asynchronous Lesson: Take your own notes in your notebook.

2
3
Open Ended
4
5
Multiple Choice
6
Multiple Choice
7
Multiple Choice
8
Multiple Choice
9
Multiple Choice
10
Dot Plots
Each dot represents one answer. In the sheet to the right, 3 students answered that they had 0 cookies at lunch. 5 said they had 2 cookies.

11
Multiple Choice

This is a
12
13
Multiple Choice

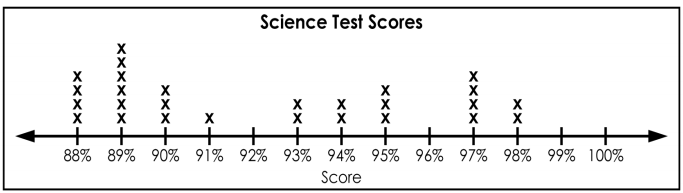
What is the outlier for this data?
14
Multiple Choice
How many students took the quiz? (count the dots)
15
Shape of a dot plot graph
Normal is like a camel hump or an upside down U.

16
Skewed Right
Think of it like a tail. The if the numbers decrease on the right side of a graph, the tail goes to the right, and the graph is skewed right.

17
Skewed Left
Our tail trails to the left, like a dinosaur. We say that these graphs are skewed left.

18
Multiple Choice

19
Multiple Choice

20
Multiple Choice

21
Multiple Choice
22
Multiple Choice
What is the outlier for this data?
23
Multiple Choice

What shape is the dot plot for SUV's?
24
25
Multiple Choice

What is the median of the data?
26
Multiple Choice

27
Multiple Choice

28
Multiple Choice

29
Multiple Choice

What is the highest score in the class?
30
Multiple Choice
What is the highest score in the class?
Statistical Questions and Dot Plots
Asynchronous Lesson: Take your own notes in your notebook.
Show answer
Auto Play
Slide 1 / 30
SLIDE
