Search Header Logo
1.1, 1.5, 1.6 review

1.1, 1.5, 1.6 review

Assessment

Presentation

Social Studies

9th Grade

Practice Problem

Medium

Created by

Abby Hogencamp

Used 7+ times

FREE Resource

18 Slides • 14 Questions

1

media
media
media

2

media
media

3

Multiple Choice

Question image

The map shows world population density. This type of thematic map is commonly used by geographers due to that fact that it is fairly simple to read.

What is the name given to this type of map?

1

chloropleth

2

cartogram

3

dot distribution

4

isoline

5

graduated symbol

4

media
media

5

Multiple Choice

Question image

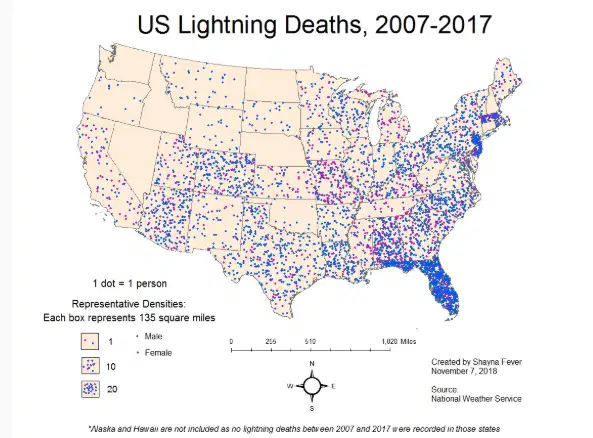
The map above illustrates how many people died after being hit by lightning in the years 2007-2017.

Pick the answer choice below that correctly identifies the type of map used to show this data.

1

flow line map

2

graduated symbol map

3

dot map

4

choropleth map

5

cartogram map

6

media
media

7

media
media
media
media
media

8

Multiple Choice

Question image

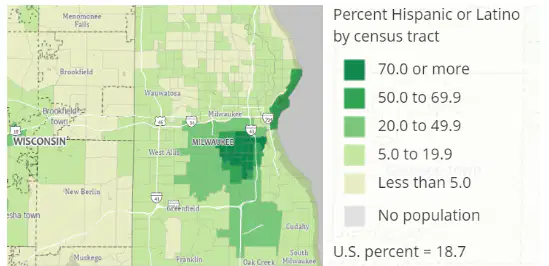
Which of the following statements best explains the spatial patterns seen in the map above?

1

Hispanic/Latino populations are evenly distributed throughout southeastern Wisconsin.

2

The largest clustering of Hispanic/Latino populations are found near Menomonee Falls.

3

Hispanic/Latino populations are dispersed throughout census tracts near Milwaukee.

4

Hispanic/Latino populations are largely clustered on the southside of Milwaukee and near Lake Michigan.

5

Hispanic/Latino populations are located in areas of lower elevation.

9

media

10

media
media

11

Multiple Choice

Question image

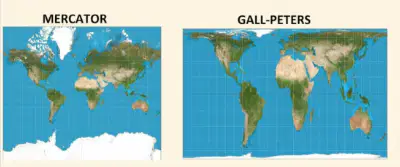
The first map above shows the Mercator Projection, created by Gerardus Mercator in 1569. The second map shows the Gall-Peters Projection, a map projection created by James Gall in 1855 and popularized by Arno Peters in the 1970s.

After analyzing the map projections, select the answer choice below that best explains how the Gall-Peters Projection tried to improve upon the Mercator Projection.

1

The Gall-Peters projection attempted to correct the sizes of continents on the world map because the Mercator projection inflated the size of socioeconomically disadvantaged regions of the world.

2

The Gall-Peters projection attempted to correct the sizes of continents on the world map because the Mercator projection diminished the size of socioeconomically disadvantaged regions of the world.

3

The Gall-Peters projection attempted to correct the distance on the world map because the Mercator projection showed distances between richer and poor areas of the world incorrectly.

4

The Gall-Peters projection attempted to correct the direction on the world map because the Mercator projection showed North, South, East, and West in a confusing way.

5

The Gall-Peters projection attempted to correct the direction on the world map because the Mercator projection made it difficult to navigate based on coordinates.

12

media
media

13

Multiple Choice

Question image

According to the Mercator Projection, which regions show the most distortion?

1

Regions only in the southern hemisphere.

2

Regions only in the northern hemisphere.

3

The mid-latitude regions.

4

The polar regions.

5

Equatorial regions.

14

media
media

15

media
media
media

16

Multiple Choice

Which of the following examples best exemplifies the concept of sustainability at a sub-national scale in the United States?

1

California’s decision to limit the use of plastic straws in restaurants.

2

President Biden’s decision to halt construction of the Keystone XL Pipeline shortly after taking office.

3

The decision of Congress to pass legislation that provides tax credits to Americans that purchase electric cars.

4

Farmers in the Midwest deciding to increase the use of mechanization to improve crop yields.

5

The decision of the United States to rejoin the Paris Agreement on Climate Change.

17

media
media

18

Multiple Choice

Interstate Park is Wisconsin's oldest state park, established in 1900 and is located along the St. Croix National Scenic Riverway. What type of land use is best demonstrated by Interstate Park?

1

agricultural

2

transportational

3

recreational

4

commercial

5

residential

19

media

20

media
media

21

Multiple Choice

Montreal's "underground city" consists of a network of tunnels and corridors that connect hotels, universities, residential and commercial complexes. This network was established in order to enable residents to move throughout the Montreal's central building district without suffering the brutal effects of Montreal's frigid winters.

This is an example of ...

1

social darwinism

2

possibilism

3

environmental determinism

4

space time compression

5

urbanization

22

media
media

23

media
media
media
media
media
media
media
media

​Local/subnational

​national

​regional

​global

​Scales of Analysis

24

Multiple Choice

Question image

What is the scale of analysis?

1

local/subnational

2

national

3

regional

4

global

25

Multiple Choice

Question image

What is the scale of analysis?

1

local/subnational

2

national

3

regional

4

global

26

Multiple Choice

Question image

What is the scale of analysis?

1

local/subnational

2

national

3

regional

4

global

27

Multiple Choice

A geographer who is comparing election results between a city, a county, and the entire state would be applying which of the following geographic concepts?

1

space-time compression

2

possibilism

3

scale of analysis

4

gerrymandering

5

distance decay

28

media
media

29

Multiple Choice

Question image

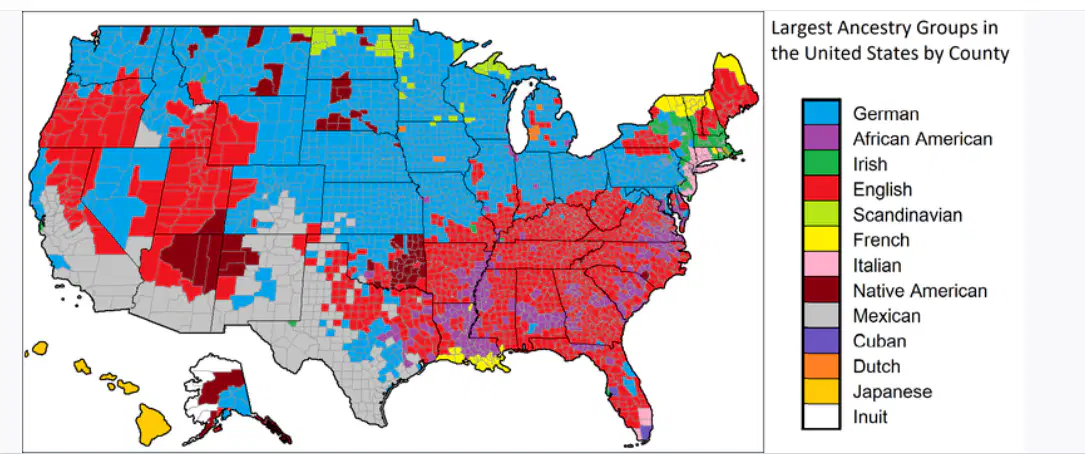
Which of the following best describes the scale of analysis of the map of the United States?

1

The scale of analysis is regional scale because the map shows clusters of ancestry groups in different parts of the United States.

2

The scale of analysis is national scale because it displays the distribution of ancestry groups across the entire United States.

3

The scale of analysis is global scale because it shows the distribution of ancestry groups that migrated from other countries throughout the world.

4

The scale of analysis is subnational because the data is displayed by U.S. counties.

5

The scale of analysis is national because the map shows only one country.

30

media
media

31

Multiple Choice

Question image

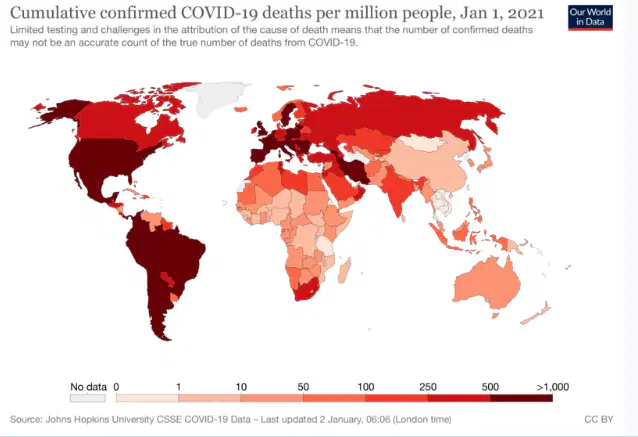
The map shows a national scale of analysis for confirmed COVID-19 deaths in countries throughout the world. Which of the following best explains a limitation of the map in understanding the extent of COVID-19 deaths at different scales of analysis?

1

The map only shows COVID-19 deaths in the most-developed regions of the world.

2

Changing the map's scale of analysis would increase its accuracy by showing regional and local distributions within countries.

3

The data in the map would be more accurately understood on a global scale map since COVID-19 is a global pandemic.

4

The data in the map would be more accurately displayed using a topographical map at a subnational scale.

5

The data is displayed using a choropleth map, but it would be more accurately understood using an isoline map.

32

media
media
media
media
media

Show answer

Auto Play

Slide 1 / 32

SLIDE