Search Header Logo
EOC Review Part 5

EOC Review Part 5

Assessment

Presentation

Mathematics

9th Grade

Hard

Created by

LAURA KNOX

Used 2+ times

FREE Resource

4 Slides • 15 Questions

1

Multiple Choice

Which scatter plot BEST represents a model of exponential growth?

1

Graph A

2

Graph B

3

Graph C

4

Graph D

2

Multiple Choice

Which scatter plot best represents a model of linear growth?

1

Graph A

2

Graph B

3

Graph C

4

Graph D

3

media

4

Multiple Choice

Question image

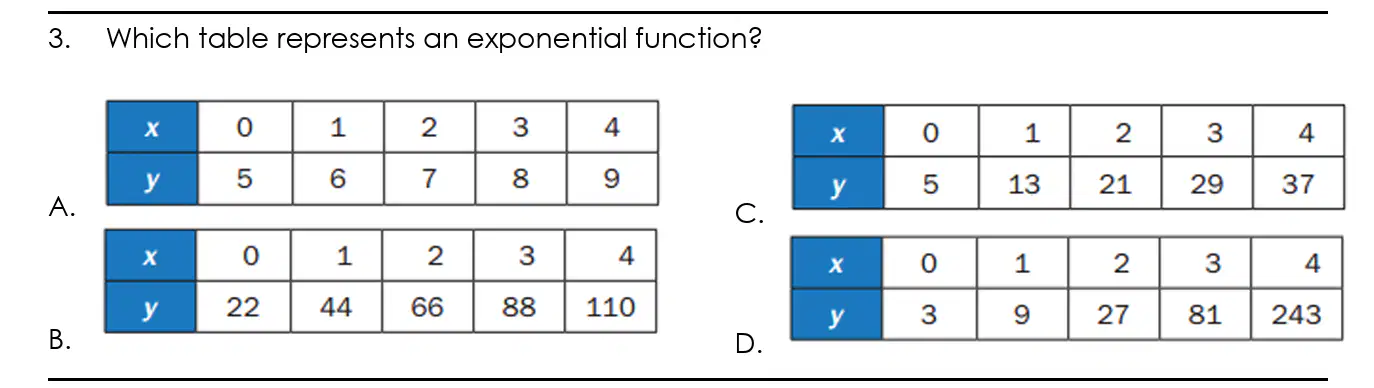
Which table represents an Exponential Function?

1

A

2

B

3

C

4

D

5

Multiple Choice

Question image

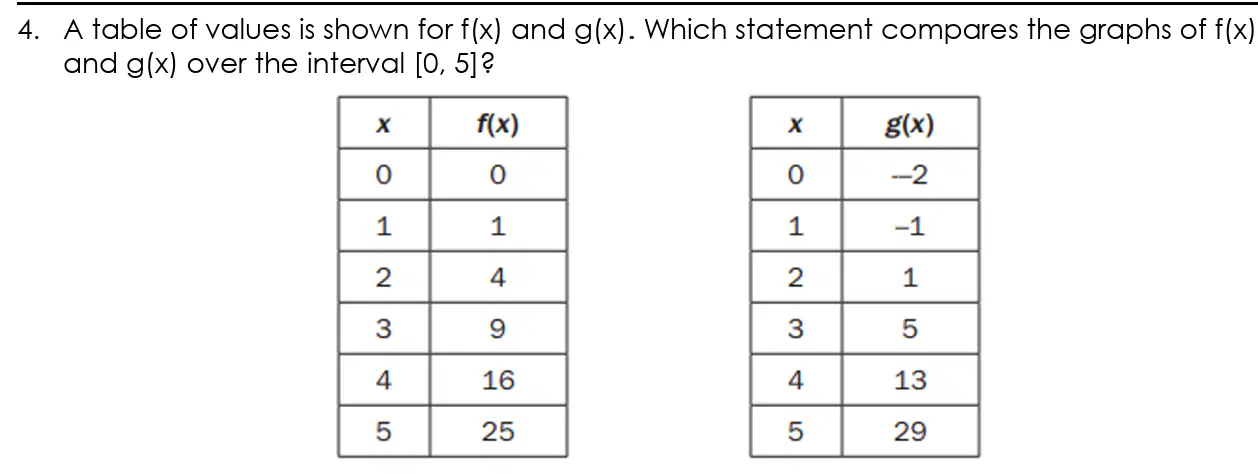
A table of values is shown for f(x) and g(x). Which statement compares the graphs of f(x) and g(x) over the interval [0, 5]?

1

The graph of f(x) always exceeds the graph of g(x) over the interval [0, 5].

2

The graph of g(x) always exceeds the graph of f(x) over the interval [0, 5].

3

The graph of g(x) exceeds the graph of f(x) over the interval [0, 4], the graphs intersect at a point between 4 and 5, and then the graph of f(x) exceeds the graph of g(x).

4

The graph of f(x) exceeds the graph of g(x) over the interval [0, 4], the graphs intersect at a point between 4 and 5, and then the graph of g(x) exceeds the graph of f(x).

6

Multiple Choice

Which statement is true about the graphs of exponential functions?

1

The graphs of exponential functions never exceed the graphs of linear and quadratic functions.

2

The graphs of exponential functions always exceed the graphs of linear and quadratic functions.

3

The graphs of exponential functions eventually exceed the graphs of linear and quadratic functions.

4

The graphs of exponential functions eventually exceed the graphs of linear functions but not quadratic functions.

7

Multiple Choice

Question image

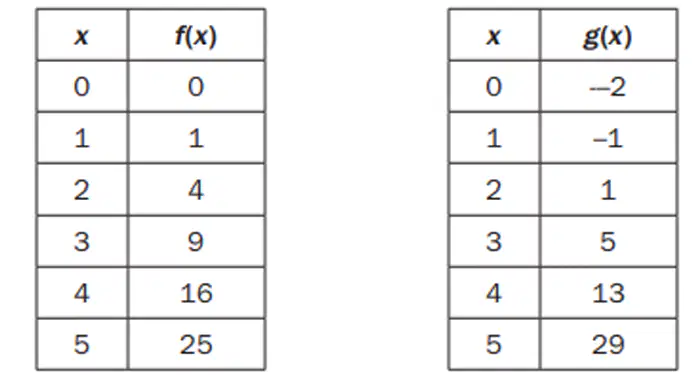
Which statement BEST describes the comparison of the function values for f(x) and g(x)?

1

The values of f(x) will always exceed the values of g(x)

2

The values of g(x) will always exceed the values of f(x)

3

The values of f(x) exceed the values of g(x) over the interval [0, 5].

4

The values of g(x) begin to exceed the values of f(x) within the interval [4, 5].

8

media

9

Multiple Choice

If the parent function is f(x) = mx + b, what is the value of m for the line passing through the points (-2, 7) and (4, 3)?

1

-9

2

-3/2

3

-2

4

-2/3

10

Multiple Choice

Consider this function for cell duplication. The cells duplicate every minute. Describe the parameters of this function. f(x)=75(2)xf\left(x\right)=75\left(2\right)^x

1

The 75 is the initial number of cells, and the 2 indicates that the number of cells doubles every minute.

2

The 75 is the initial number of cells, and the 2 indicates that the number of cells increases by 2 every minute.

3

The 75 is the number of cells at 1 minute, and the 2 indicates that the number of cells doubles every minute.

4

The 75 is the number of cells at 1 minute, and the 2 indicates that the number of cells increases by 2 every minute.

11

Multiple Choice

What is the y-intercept of the graph of h(x)=2x4h(x)=2^x-4 ?

1

(0, -4)

2

(0, -3)

3

(0, 1)

4

(0, 2)

12

Multiple Choice

What is the range of the graph of f(x) = -3(x – 4)?

1

(-3, 4)

2

(-3, ∞)

3

(-∞, 4)

4

(-∞, ∞)

13

Multiple Choice

Question image

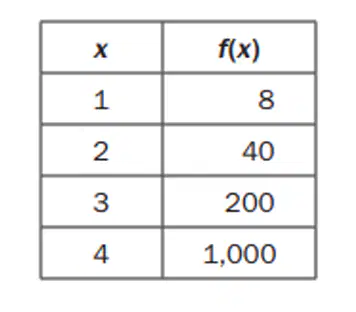
Which function is modeled in this table?

1

f(x) = x + 7

2

f(x) = 5x + 8

3

f(x)=(8)xf(x)=(8)^x

4

f(x)=85(5)xf(x)=\frac{8}{5}(5)^x

14

Multiple Choice

If f(12) = 4(12) – 20, which function gives f(x)?

1

f(x)=4x220f(x)=4x^2-20

2

f(x)=4x20f(x)=4^x-20

3

f(x) = 4x – 20

4

f(x)=4x2+12x20f(x)=4x^2+12x-20

15

Multiple Choice

Which function has a range of f(x)34?f(x)\le\frac{3}{4}? ?

1

A. f(x) = ¾x + 5

2

f(x)=x2+34f(x)=-x^2+\frac{3}{4}

3

f(x)=x234f(x)=x^2-\frac{3}{4}

4

f(x) = ¾ - 5x

16

media

17

Fill in the Blanks

18

Multiple Choice
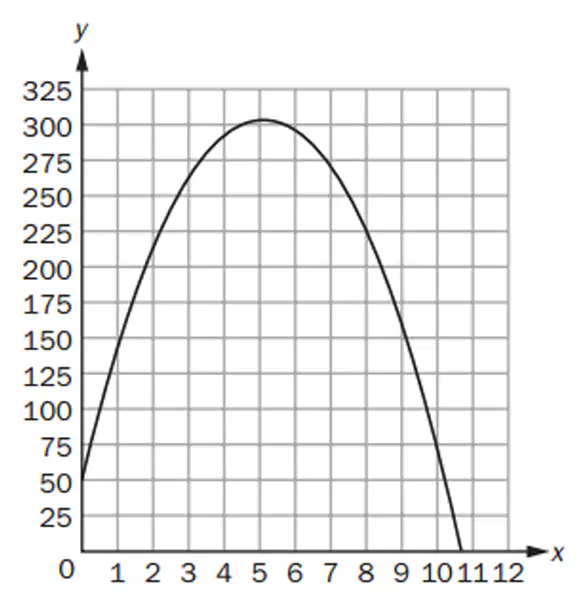
Question image

The graph shows the height, y, in meters, of a rocket above sea level in terms of the time, t, in seconds, since it was launched. The rocket landed at sea level. What does the x-intercept represent in this situation?

1

The height from which the rocket was launched

2

The time it took the rocket to return to the ground

3

The total distance the rocket flew while it was in flight

4

The time it took the rocket to reach the highest point in its flight

19

media

Which scatter plot BEST represents a model of exponential growth?

1

Graph A

2

Graph B

3

Graph C

4

Graph D

Show answer

Auto Play

Slide 1 / 19

MULTIPLE CHOICE