
G6 MATH Final Exam Review
Presentation
•
Mathematics
•
2nd Grade
•
Practice Problem
•
Medium

Ruwaida Bhaijee
Used 9+ times
FREE Resource
26 Slides • 27 Questions
1

2

3
Multiple Choice

4

5
Multiple Choice
6

7
Multiple Choice

8


9
Multiple Choice

10

11
Multiple Choice
12

13
Multiple Choice

14

15
Multiple Choice
16

17
Multiple Choice
18
Multiple Choice

19

20
Draw
21

22
Multiple Choice
23
Multiple Choice
24

25
Multiple Choice
26

27
Multiple Choice
28

29
Multiple Choice
30

31
Multiple Choice
32

33
Multiple Select
34

35
Draw
36

37

38
Draw
39
Multiple Choice

40


41
Multiple Choice
42

43
Draw
44

45
Draw
46


47
Multiple Choice

48

49
Multiple Choice
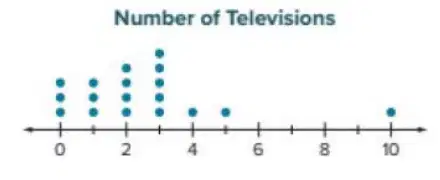
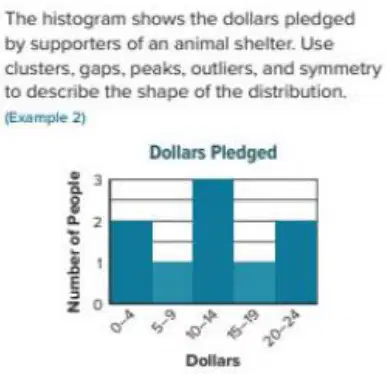
Identify the SYMMETRY, PEAK, OUTLIER, GAP and CLUSTER.
50

51
Multiple Choice
Identify the SYMMETRY, PEAK, OUTLIER, GAP and CLUSTER.
52

53
Multiple Choice
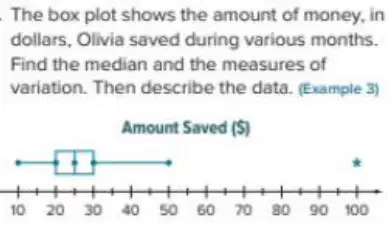
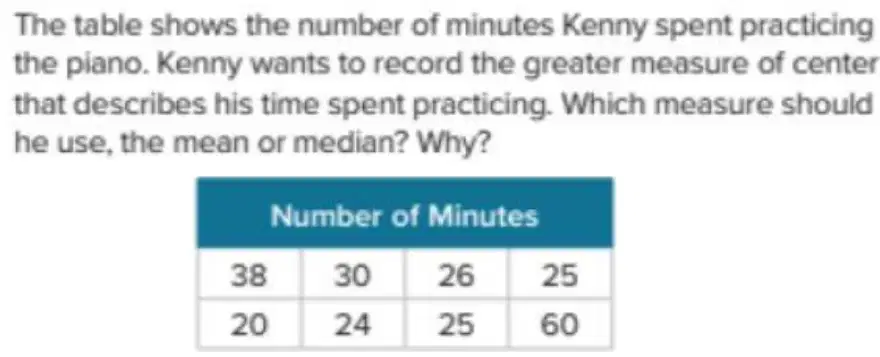
Find the Median and the Measures of Variation.
Show answer
Auto Play
Slide 1 / 53
SLIDE
