
Tables and graphs
Presentation
•
Mathematics
•
7th - 12th Grade
•
Easy
+5
Standards-aligned

Sharon Rummins
Used 3+ times
FREE Resource
13 Slides • 27 Questions
1
2

3

4
Multiple Choice

The table shows the x and y values for the equation
y = x - 6.
What is the missing number?
5
Multiple Choice

The table shows the x and y values for the equation
y = 2x + 1.
Find the missing y value.
6
Multiple Choice

The table shows the x and y values for the equation
y = 9x - 1.
Find the missing y value.
7

8


9
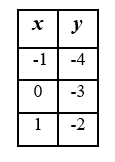
Multiple Choice

What is the rule (equation) for this table?
10
Multiple Choice

What is the rule (equation for this table?
11
Multiple Choice

Which table is correct for y=4x+3?
12
Multiple Choice

Which equation matches the table?
13
Multiple Choice

Find the equation of the line
14
Multiple Choice

Find the equation of the line
15
Multiple Choice

Find the equation of the line
16
Multiple Choice

Three tables of values are shown.
Which table shows the x and y values for the equation
y = x + 5?
17
Multiple Choice
18


19
20

21
Multiple Choice

Which equation describes the table shown?
22
Multiple Choice

Which equation matches the table?
23


24

25


26
Multiple Choice
27
Multiple Choice

Which graph represents the table?
28
Multiple Choice
29
Multiple Choice

Which company shows a greater rate of change (gradient)?
30
Multiple Choice
Which graph represents the table?
31

32
Multiple Choice

What is the point of intersection?
33
Multiple Choice

What is the point of intersection?
34
Multiple Choice

What is the point of intersection?
35
Multiple Choice

What is the point of intersection?
36
Multiple Choice

What is the point of intersection?
37

38
Poll
39
Poll
40
Poll
Show answer
Auto Play
Slide 1 / 40
SLIDE
