

IGCSE-Hazards 7-Tsunami

Presentation
•
Geography
•
9th - 10th Grade
•
Practice Problem
•
Easy

Aimee Cooper
Used 6+ times
FREE Resource
39 Slides • 23 Questions
1
Match
Match the definitions
The number of babies born per 1000 per year
The number of deaths per 1000 per year
The average number of babies a woman will have in her lifetime
The change in population numbers
The number of people of working age vs the number of old and young
Birth rate
Death rate
Fertility rate
Natural Increase
Dependency ratio
Birth rate
Death rate
Fertility rate
Natural Increase
Dependency ratio
2
Multiple Choice
Which of these conditions are ideal for coral reefs?
cold and deep water
warm and shallow water
cold and shallow water
warm and deep water
3
Match
Match the following
Groynes
sea wall
revetments
gabions
rock armour
Groynes
sea wall
revetments
gabions
rock armour
4
Open Ended
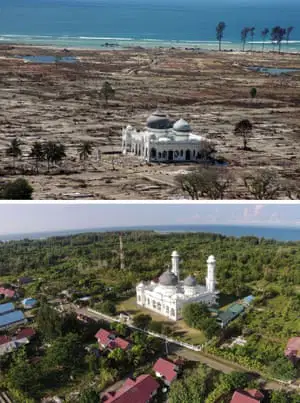
What has happened here?
5
IGCSE-Hazards-Tsunami
By Aimee Cooper
6
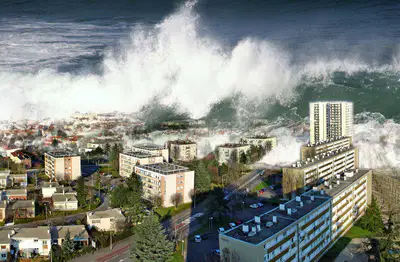
To explain the physical processes that create tsunamis.
To describe the sequence of tsunami development.
To understand the causes and impacts of the Indian Ocean tsunami (2004).
Lesson Objectives
7
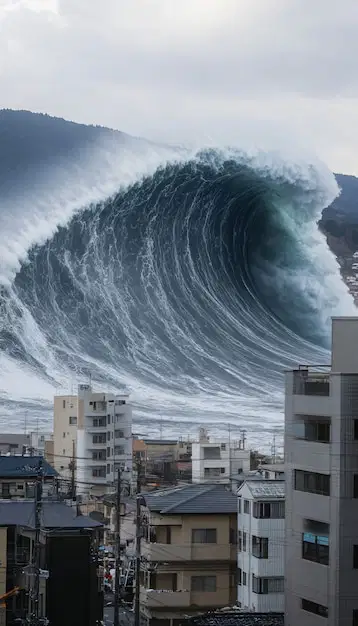
Important: tsunamis are NOT tidal waves.
Tides are caused by the moon’s gravitational pull.
Tsunamis are caused by sudden displacement of water (usually earthquakes).
Myth Buster!
8
Open Ended
How is a tsunami formed?
9
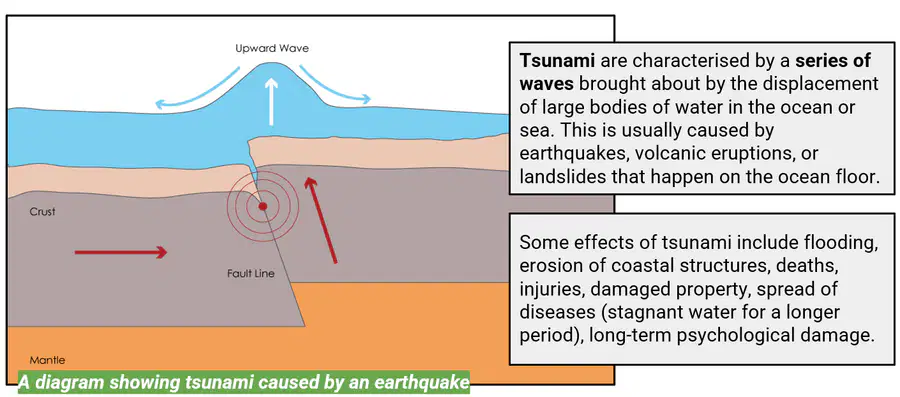
How a tsunami is triggered
10
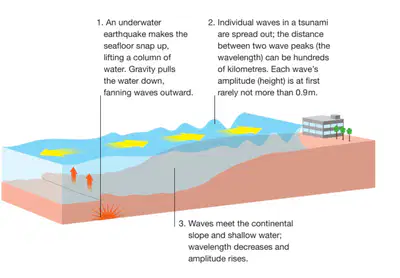
How a tsunami is triggered
Underwater earthquake occurs at a plate boundary.
Water column above the fault is displaced.
Waves spread outward at up to 800 km/h.
In deep water, they are low and not noticed.
As they reach shallow water, they slow down, wavelength shortens, and height increases
11
Labelling
Label the process of tsunami formation
Waves spread.
Seafloor snaps upwards
Waves increase height near shore.
Water displaced.
12
13

14
Pressure builds under the surface at a tectonic plate boundary for a very long time until it is released in an earthquake or volcanic eruption.
The rock is pushed upwards after the earthquake, shifting the ocean water and causing a wave to form.
Waves out at sea are often small, but travel at hundreds of miles an hour.
As waves move into shallow water they slow down.
The back of the wave is still moving faster than the front, so the back rises causing a massive wave to form (often as high as 50ft).
The massive wave hits the shore and travels inland, destroying objects and buildings in its path
15
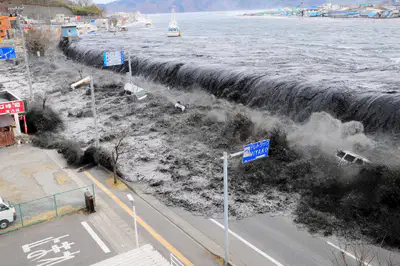
Tsunami waves can travel at 800 km/h across oceans.
In deep water, waves are low (<1m) and barely noticed.
As waves approach shallow water, their wavelength shortens and amplitude increases dramatically.
Scientific Detail
16
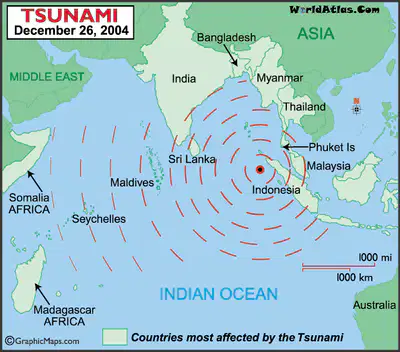
Date: 26th December 2004
Magnitude: 9.1 undersea earthquake (Sumatra)
Wave height: up to 30m
Countries affected: Indonesia, Sri Lanka, India, Thailand, Maldives
Case Study Intro: Indian Ocean Tsunami 2004
17
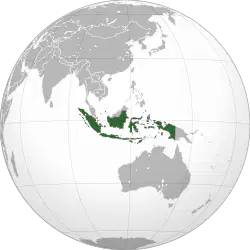
Indonesia: lower-middle income country (LIC/NEE).
GDP per capita in 2004: ~$1,000.
High population density along coastlines.
Infrastructure weak (roads, hospitals, communications).
Heavy reliance on fishing and tourism.
No Indian Ocean tsunami warning system in place.
Background: Indonesia (at time of tsunami)
18
Open Ended
What are the impacts of a large scale tsunami?
19
Categorize
Mass deaths & injuries
2 million displaced
Families separated
PTSD and long-term trauma
Billions of $ in losses
Fishing fleets destroyed
Ports unusable
Tourism collapse
Crops & farmland ruined by saltwater
Ecosystems destroyed
Coral reefs/mangroves damaged
Impacts of Indian Ocean Tsunami 2004
20

~300,000 people killed.
2 million displaced.
Families torn apart, thousands of orphans.
Survivors faced trauma and PTSD.
Impacts (Social)
21

~$10 billion of losses.
Ports and transport destroyed.
Fishing fleets destroyed = livelihoods lost.
Tourism collapsed in Thailand and Sri Lanka.
Impacts (Economic)
22
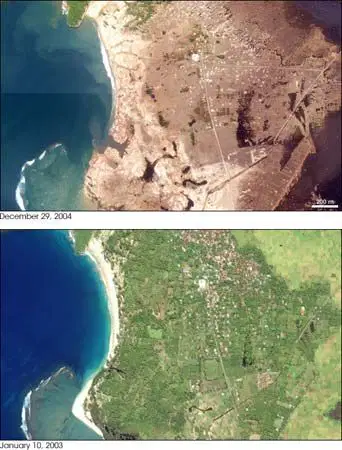
Farmland ruined by saltwater flooding.
Freshwater wells contaminated.
Mangroves, coral reefs, and beaches destroyed.
Whole villages and ecosystems swept away.
Impacts (Environmental)
23
Open Ended
Why was it so deadly?
24
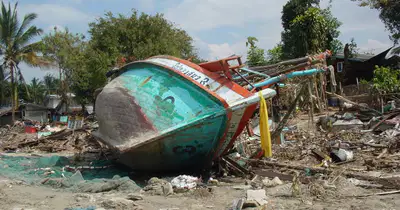
No warning system in Indian Ocean.
Many lived in weak coastal housing.
High coastal population density.
Tourists didn’t recognise warning signs.
Aid was delayed due to poor roads and communications.
Why was the Indian Ocean Tsunami so Deadly?
25
26
Multiple Select
Which facts are true?
The Indian Ocean had no warning system in 2004.
Waves hit within 10 minutes of the quake.
The tsunami only affected Indonesia.
Saltwater ruined farmland.
27
Open Ended
“Explain why the Indian Ocean tsunami caused such high death tolls.”
(6 marks, PEE).
28
One reason the Indian Ocean tsunami caused so many deaths was the lack of an early warning system. When the earthquake struck off Sumatra, people in nearby coastal areas had no official alerts and little time to evacuate. This meant thousands of people were caught by surprise and unable to escape before the waves arrived.
Another reason was the high population density along vulnerable coastlines. Many people lived in low-lying areas close to the sea, and their homes were built from weak materials like wood and corrugated metal. As a result, whole communities were destroyed instantly, and people were trapped in collapsed buildings.
A further factor was the slow emergency response. Many countries affected were LICs with poor infrastructure, so it took days or even weeks for international aid to arrive. This delay meant that injured survivors often died from lack of medical care, food, and clean water, which increased the overall death toll.
Model Answer
29
Short-Term Responses (Indian Ocean 2004)
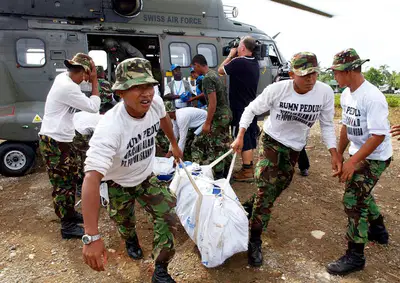
Emergency aid rushed in: food, water, and medical care.
International community donated billions of dollars.
Rescue operations saved trapped survivors.
Temporary shelters were built for displaced families.
30
Long-Term Responses (Indian Ocean 2004)
Indian Ocean tsunami warning system established in 2006.
Coastal zoning laws introduced in several countries.
Education programmes teach people to recognise warning signs.
Rebuilding focused on stronger housing and more resilient infrastructure.
International NGOs supported mental health and community rebuilding.
31
Open Ended
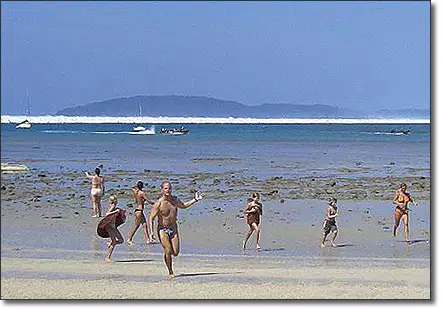
What are the early warning signs?
32
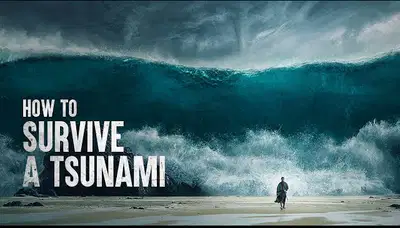
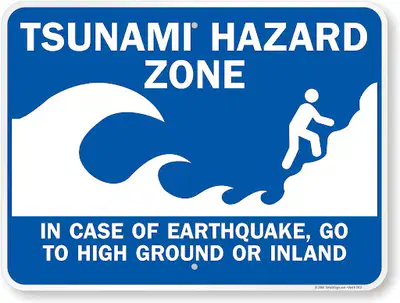
Recognise signs: earthquake, sea withdrawal.
Move inland and uphill immediately.
Do not wait for officials.
Do not return until safe
How to survive a tsunami
33
34
Multiple Choice
Which is NOT a survival strategy?
Evacuate uphill.
Recognise sea withdrawal.
Stay to film the waves.
Evacuation drills.
35
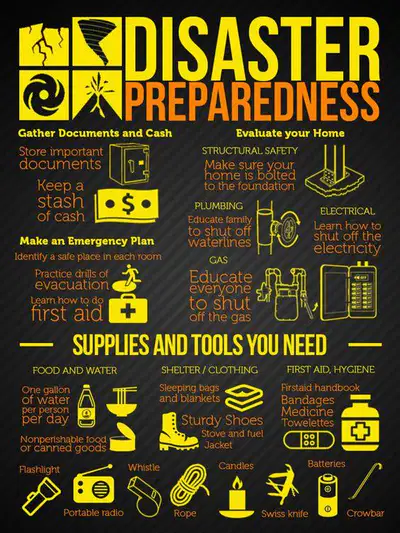
Prevention: hazard mapping, zoning, seawalls.
Preparedness: drills, education, warning systems.
Response & recovery: aid, rebuilding, counselling.
Disaster Management
36
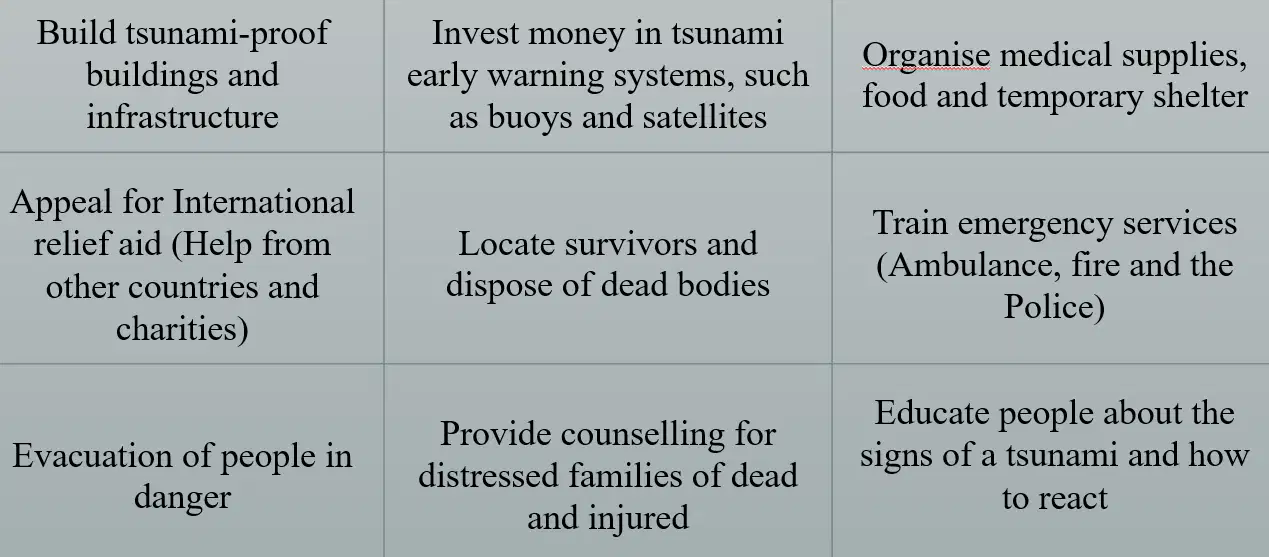
You are going to design a tsunami disaster management plan.
Complete the diamond rank exercise to decide your management priorities
§Most important at the top
§Least important at the bottom
Explain why you placed them there.
Tsunami disaster management plan
37
Labelling
Complete the diamond rank exercise to decide your management priorities
§Most important at the top
§Least important at the bottom
Educate people about the signs
Evacuation of people in danger
Appeal for International relief aid
Train emergency services
Locate survivors and dispose of dead
Organise medical supplies,food,shelter
Build tsunami-proof buildings
Provide counselling for distressed
Invest money in early warning systems
38
Open Ended
Explain your most and least important choices
39
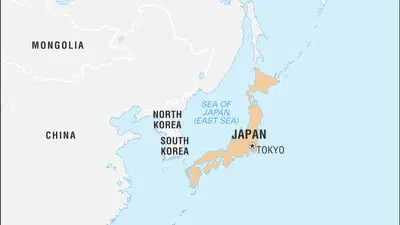
Japan: High-Income Country (HIC).
GDP per capita in 2011: ~$40,000.
Advanced earthquake monitoring and tsunami warning systems.
Strict building regulations: earthquake-resistant structures.
Well-developed infrastructure (roads, hospitals, emergency services)
Background: Japan 2011 (Tohoku tsunami)
40
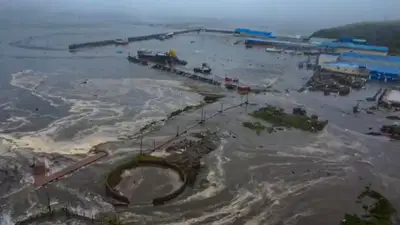
Date: 11th March 2011.
Magnitude: 9.0 undersea earthquake, 70 km off Tohoku coast.
Tsunami waves up to 40m.
Fukushima nuclear plant damaged.
Case Study Intro: Japan Tsunami 2011
41
42
Categorize
20,000 people killed.
500,000 displaced into temporary shelters.
Elderly most affected due to mobility issues
~$300 billion damage (most expensive disaster in history).
Ports, roads, and infrastructure destroyed
Car manufacturing halted (Toyota, Nissan)
Fukushima nuclear plant meltdown = long-term energy crisis
Agricultural land contaminated by saltwater and radiation
Large areas flooded.
Ecosystems destroyed.
Sort the impacts
43
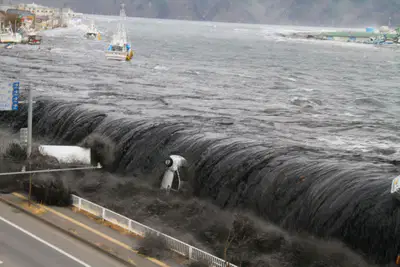
~20,000 people killed.
500,000 displaced into temporary shelters.
Elderly most affected due to mobility issues
Social Impacts (Japan)
44
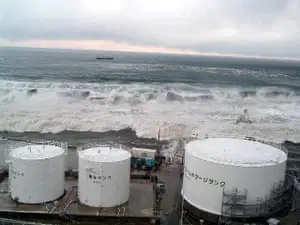
~$300 billion damage (most expensive disaster in history).
Ports, roads, and infrastructure destroyed.
Car manufacturing halted (Toyota, Nissan).
Fukushima nuclear plant meltdown = long-term energy crisis
Economic Impacts (Japan)
45
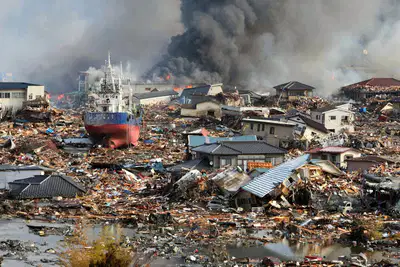
Agricultural land contaminated by saltwater and radiation.
Large areas flooded.
Ecosystems destroyed.
Environmental Impacts (Japan)
46
Open Ended
Explain why the long-term impacts of tsunamis can be more severe than the immediate impacts.”
Point: What happens immediately.
Evidence: Short-term (injuries, deaths).
Explain: Why long-term (homelessness, PTSD, ruined farmland, loss of livelihoods) can last longer and cost more.
47
Model Answer
The immediate impacts of a tsunami include deaths, injuries, and destruction of buildings, but these often last for only a few days or weeks. The long-term impacts can be much more severe because they continue for years.
One long-term impact is homelessness and displacement. After the Indian Ocean tsunami, around 2 million people were left without homes, and many spent years in temporary shelters.
Another long-term impact is loss of livelihoods. Tourism in Thailand and Sri Lanka collapsed for several years, and in Indonesia, fishing fleets were destroyed. This left thousands of people without income.
Finally, the psychological impacts can last for decades. Survivors suffered from trauma and PTSD, which affected their ability to work and rebuild their lives. This shows that the social and economic consequences can continue long after the immediate disaster.
48
Open Ended
How did Japan respond to this? Think long term
49
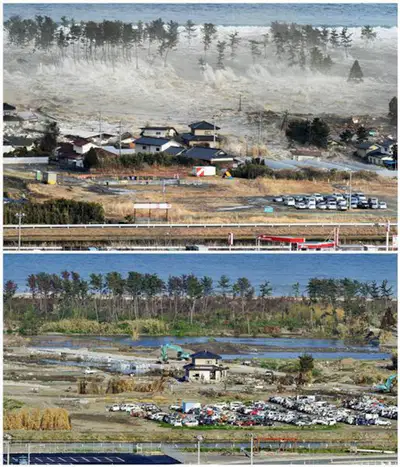
Seawalls rebuilt and strengthened along much of Japan’s coast.
Stricter safety regulations for nuclear plants after Fukushima disaster.
Early warning systems upgraded to give quicker alerts.
Billions invested in rebuilding homes, schools, and industry.
Japan 2011 Long-Term Responses
50
Open Ended
Which Tsunami do you think was worse?
51
Comparison Task: LIC vs HIC
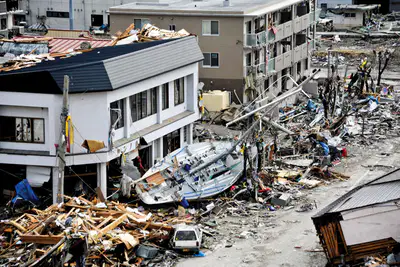
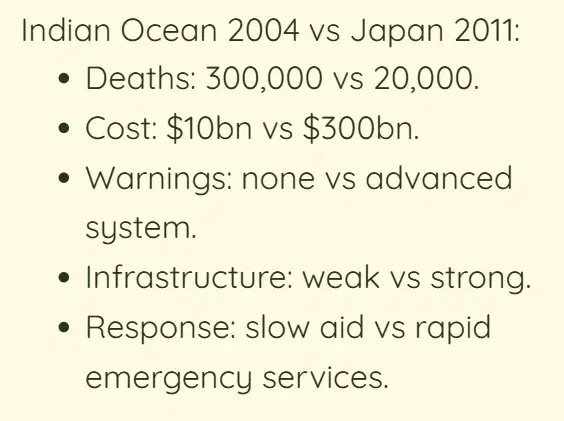
Indian Ocean 2004 vs Japan 2011:
Deaths: 300,000 vs 20,000.
Cost: $10bn vs $300bn.
Warnings: none vs advanced system.
Infrastructure: weak vs strong.
Response: slow aid vs rapid emergency services.
52
Open Ended
“Explain why impacts of tsunamis are often greater in LICs than in HICs.”
Use evidence from 2004 Indian Ocean and 2011 Japan.
53
The impacts are often greater in LICs because they lack advanced warning systems. In the 2004 Indian Ocean tsunami, no alarms were in place, so people had no time to evacuate. In contrast, Japan in 2011 had a sophisticated warning system which saved lives.
Another reason is weaker infrastructure in LICs. In Indonesia and Sri Lanka, poorly built houses collapsed instantly, causing higher death tolls. By comparison, Japan had earthquake-resistant buildings that withstood some of the shaking, although the waves still caused damage.
LICs are also less able to cope with recovery. After 2004, many families in the Indian Ocean region were homeless for years because rebuilding was slow and dependent on international aid. Japan, however, could spend billions on rapid reconstruction.
Overall, LICs suffer greater social and economic impacts because they lack the resources, preparation, and infrastructure of HICs.
Model Answer
54
Open Ended
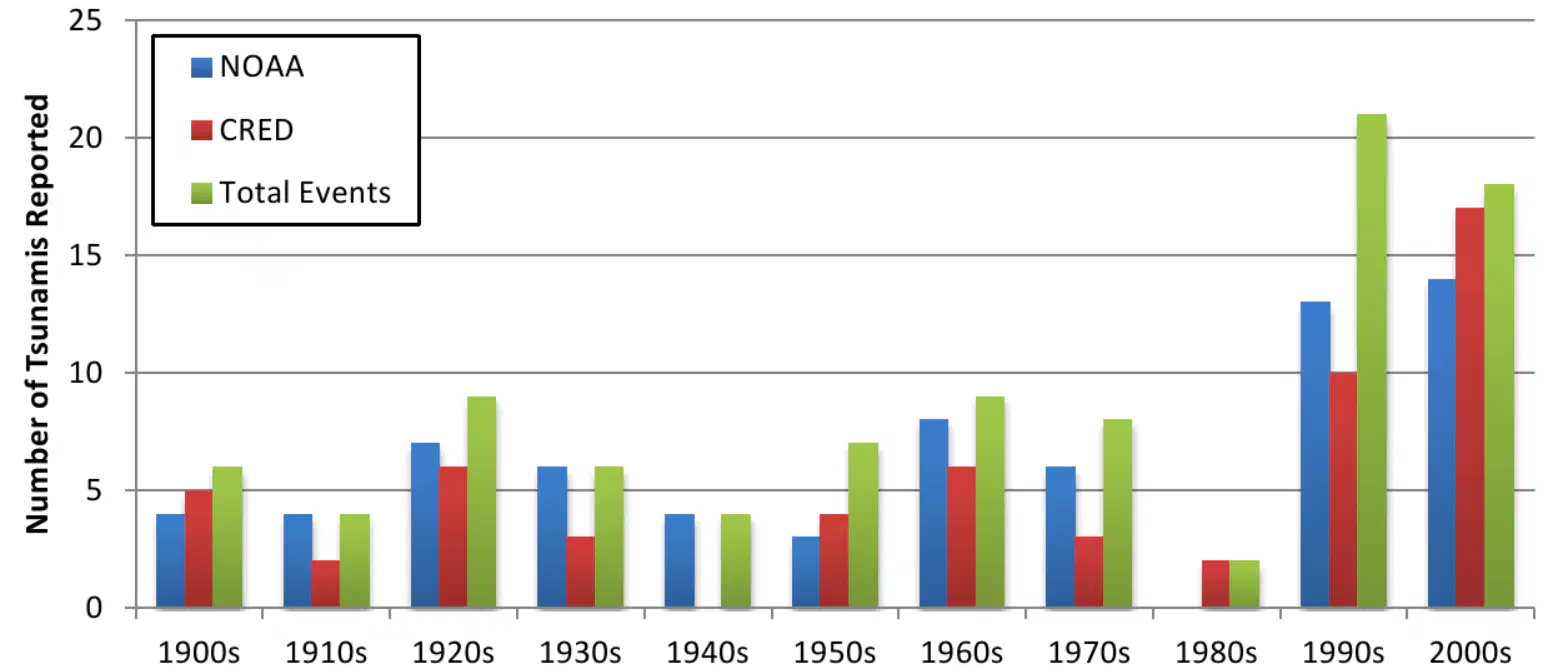
Describe the trend in the number of tsunamis
55
Open Ended
Why is this happening?
56
This graph shows the number of tsunamis reported from 1900s–2000s.
At first it looks like tsunamis are becoming more frequent, especially in the 1990s and 2000s.
But…
The Earth is not suddenly producing far more tsunamis.
The increase is partly due to:
Better monitoring technology (seismometers, satellites, deep-ocean sensors).
More communication → easier to share data worldwide.
More people living by coasts → events are more likely to be reported.
More historical records being digitised.
Conclusion:
Tsunamis are not necessarily happening more often — they are just being recorded and reported more accurately in recent decades.
57
To explain the physical processes that create tsunamis.
To describe the sequence of tsunami development.
To understand the causes and impacts of the Indian Ocean tsunami (2004).
Lesson Objectives
58
Past Exam Qs
59
Open Ended
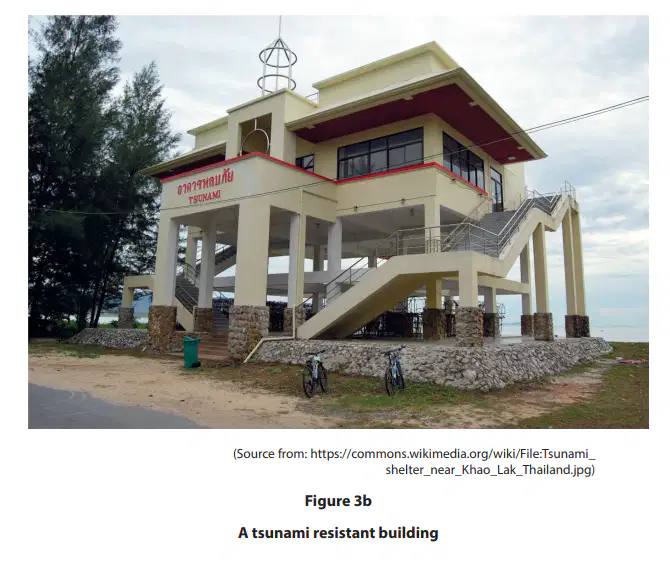
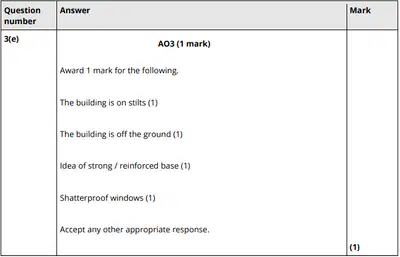
(e) Study Figure 3b in the Resource Booklet. Identify one feature of this building that makes it more tsunami resistant. (1)
60
61
Homework
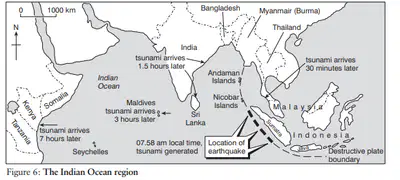
Task 1 – Map Skills (short questions)
At what time (local) was the tsunami generated?
How long after the earthquake did the tsunami reach:
a) Thailand?
b) India?
c) The Maldives?
d) Somalia?Which countries were hit within 30 minutes of the earthquake?
Which country shown on the map had the longest time before the tsunami arrived?
Task 2 – Interpreting the Map
Why did countries further from the earthquake epicentre, such as Somalia and the Seychelles, still experience devastating waves?
How does this map help to explain why the Indian Ocean tsunami affected so many different countries?
62
Match the definitions
The number of babies born per 1000 per year
The number of deaths per 1000 per year
The average number of babies a woman will have in her lifetime
The change in population numbers
The number of people of working age vs the number of old and young
Birth rate
Death rate
Fertility rate
Natural Increase
Dependency ratio
Birth rate
Death rate
Fertility rate
Natural Increase
Dependency ratio
Show answer
Auto Play
Slide 1 / 62
MATCH
Similar Resources on Wayground

57 questions
Biology Review Lesson
Presentation
•
9th - 10th Grade
56 questions
Energy Changes in Reactions
Presentation
•
9th - 10th Grade
55 questions
T3 C3 S1: Angles formed by Chords, Tangents, and Secants
Presentation
•
8th - 10th Grade
57 questions
Prehistory
Presentation
•
9th - 10th Grade
59 questions
Ecosystems Revision!
Presentation
•
10th Grade
56 questions
Copy of G2_K9_L11_22-23
Presentation
•
KG
56 questions
SEV1a par 2Lesson
Presentation
•
9th - 10th Grade
60 questions
3B Test
Presentation
•
9th Grade
Popular Resources on Wayground
11 questions
Hallway & Bathroom Expectations

Quiz
•
6th - 8th Grade
10 questions
HCS SCI 03 Summer School Assessment 2
Quiz
•
3rd Grade
11 questions
Home Scope
Quiz
•
7th - 8th Grade
12 questions
2026 TAP Technology in the Classroom
Presentation
•
Professional Development
15 questions
HCS SCI 05 Summer School Assessment 2 Review
Quiz
•
5th Grade
15 questions
HCS SCI 04 Summer School Review 2
Quiz
•
4th Grade
59 questions
Geometry Unit 3 Review
Quiz
•
9th - 12th Grade
14 questions
FAST ELA READING SMAPLE TEST MATERIALS

Passage
•
3rd Grade