Search Header Logo
  1. Resource Library
  2. Science
  3. Earth & Space Science
  4. Earth And Space Science Csa Review
Earth and Space Science CSA Review

Earth and Space Science CSA Review

Assessment

Presentation

•

Science

•

6th - 8th Grade

•

Easy

•
NGSS.MS-ESS2-4, AR.CF.SCI.6-ESS2-5, NGSS.MS-ESS1-1

+8

Standards-aligned

Created by

Jeff Christmas

Used 7+ times

FREE Resource

7 Slides • 10 Questions

1

media

2

Multiple Choice

Question image

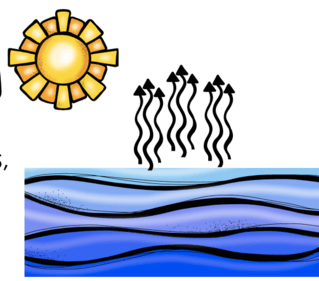
What powers the water cycle?

1

Moon

2

Sun

3

Mars

4

Electricity

3

Multiple Choice

Question image
What part of the water cycle does this picture show?
1
condensation
2
precipitation
3
evaporation

4

Multiple Choice

Question image

Students in a 5th grade science class performed the experiment below. They filled a bag partially with water and taped it to a window on a sunny day. After 2 hours the students observed that the bag above the water began to look cloudy. Why does the bag appear to look cloudy?

1

Energy from the sun causes liquid water to turn into water vapor.

2

Energy from the air in the bag heats up and begins to boil.

3

Energy from the sun heats the ice cubes in the bag and cause them to melt into liquid water.

4

Part of the water escapes the bag and condensation is happening on the outside.

5

media

6

Multiple Choice

What is the average solar energy received in Sacramento during the month of July?

1

10 million J/m²/day

2

20 million J/m²/day

3

30 million J/m²/day

4

35 million J/m²/day

7

media

8

Dropdown

In winter precipitation is greater, and evaporation is less. In summer precipitation is ​
, and evaporation is​
.

9

Open Ended

Describe what happens to water during evaporation.

10

media

11

Multiple Choice

Which piece of additional data should be collected to explain the differences in snowfall between Rochester and Syracuse?

1

air mass temperatures over Lake Ontario

2

average air pressure over each city

3

amount of Lake Ontario covered by ice

4

distance between the two cities

12

media

13

Multiple Select

Select the boxes to indicate the weather data from Table 1 that are needed to describe why the temperature increased in Phoenix.

1

Temperature

2

Humidity

3

Pressure

4

Wind Speed

5

Wind Direction

14

media

15

Multiple Choice

Question image

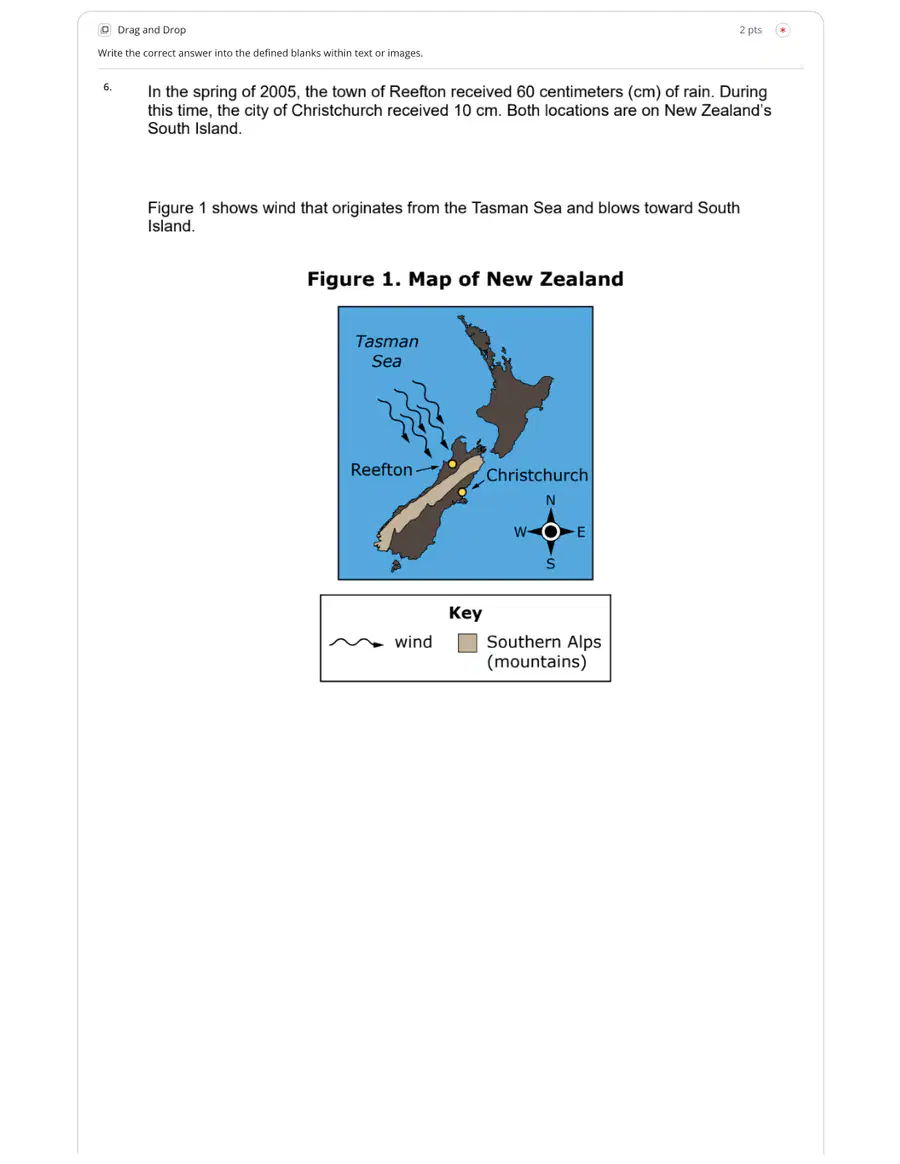
Use the diagram to answer the following question: On the side of the mountain facing the wind, air rises, ______________, and drops its moisture as precipitation.

1

heats

2

freezes

3

cools

4

dries

16

media

17

Multiple Choice

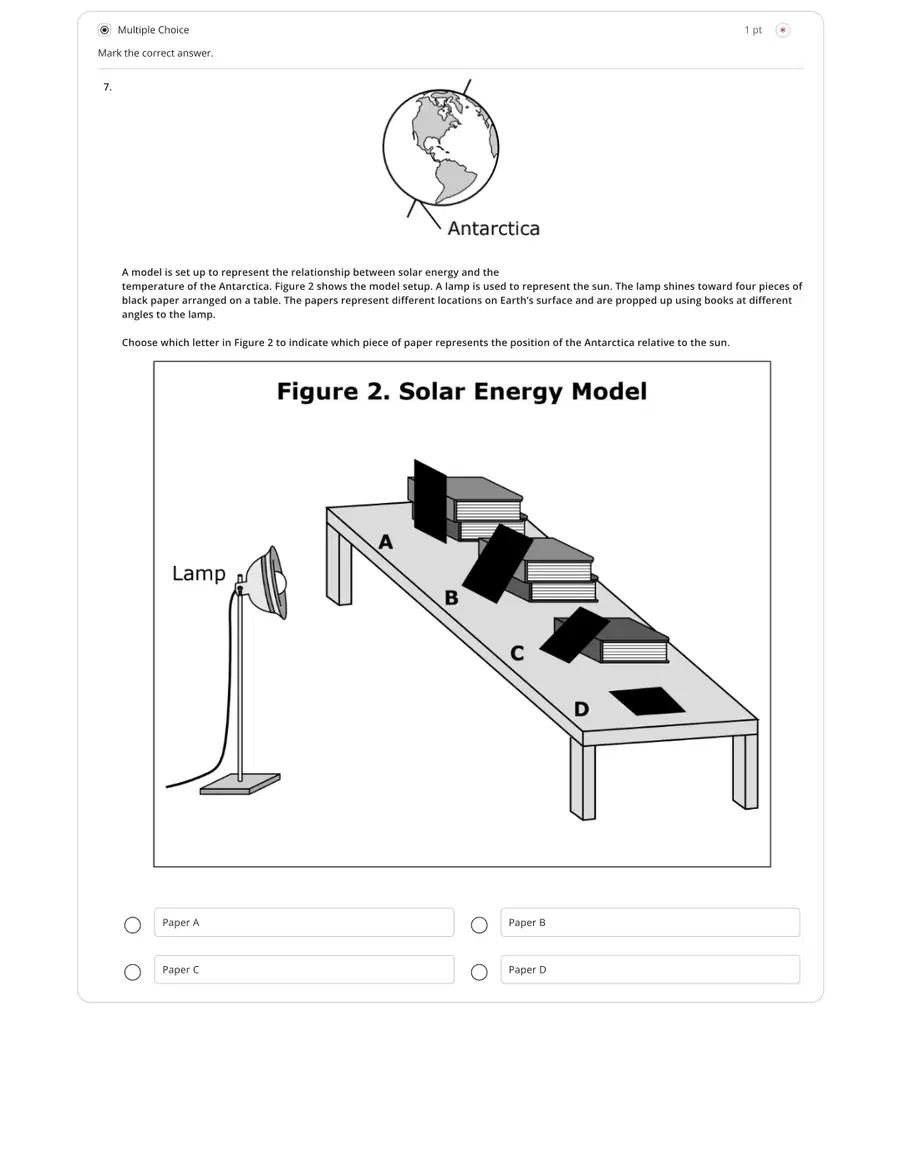
How does the tilt of Earth's axis influence the intensity of sunlight?

1

It makes Earth closer to the sun in summer

2

It affects the intensity of sunlight energy that reaches Earth

3

It causes one side of Earth to face the sun longer in summer

4

It has no significant effect

pattern-tertiary
media

Show answer

Auto Play

Slide 1 / 17

SLIDE