
Linear Relationships and Slope
Presentation
•
Mathematics
•
9th - 12th Grade
•
Hard
+2
Standards-aligned

Maria Durham
FREE Resource
6 Slides • 25 Questions
1
2
3


4
Multiple Choice

Is this relationship represented by the graph Linear or Nonlinear
5
Multiple Choice
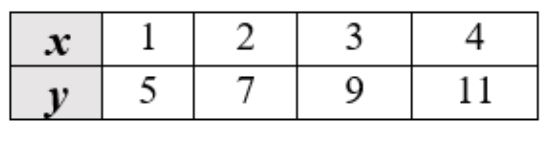
Is the relationship represented by the table linear or nonlinear?
6
Multiple Choice
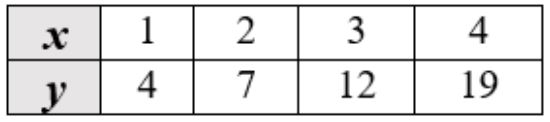
Is the relationship represented by the table linear or nonlinear?
7
Multiple Choice

Is the relationship represented by the graph linear or nonlinear
8
Multiple Choice

9
Multiple Choice

Which graph is linear?
10
Multiple Choice

Why is this relationship linear?
11
Multiple Choice
Is the relationship represented by the table linear or nonlinear?
12
Multiple Choice

13
Multiple Choice
14
Multiple Choice
15
Multiple Choice
16
17


18

19
Multiple Choice
20
Multiple Choice
21
Multiple Choice
22
Multiple Choice
23
Multiple Choice

Find the rate of change
24
Multiple Choice

What is the slope of the line? Be sure to simplify.
25
Multiple Choice

Find the slope of the line
26
Multiple Choice
27
Multiple Choice

What kind of slope is this?
28
Multiple Choice

What kind of slope is this?
29
Match
30
Multiple Choice

What is the slope of the line represented by the table?
31
Multiple Choice

What is the slope of this line?
Show answer
Auto Play
Slide 1 / 31
SLIDE
