Search Header Logo
Lesson 4: What's my rate?

Lesson 4: What's my rate?

Assessment

Presentation

Mathematics

9th - 12th Grade

Practice Problem

Easy

Created by

Amy Hurley

Used 1+ times

FREE Resource

5 Slides • 18 Questions

1

Lesson 4: What's my rate?

By Amy Hurley

2

Open Ended

Question image

Use what you have learned about rates so far to answer the following questions.

  1. Terrence skated 8 feet in 4 seconds at a constant rate. How fast did he skate in feet per second?

3

Open Ended

Question image

Use what you have learned about rates so far to answer the following questions.

  1. An elevator traveled from the 10th floor to the 2nd floor in 6 seconds. What was the rate of the elevator in floors per second

4

Open Ended

Question image

Use what you have learned about rates so far to answer the following questions.

  1. A car traveled 300 miles in 6 hours. What was the car’s rate in miles per hour?

5

media

In today's lesson, you will focus on the following highlighted goals from this topic:

  • Create motion graphs (distance vs. time) and investigate how changes in motion affect the graph

  • Find rates for data in tables

  • Find rates from graphs

Lesson preview

6

Open Ended

Question image

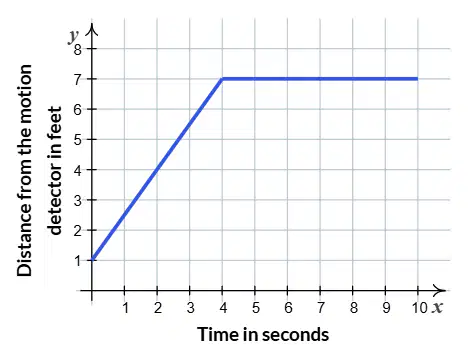
This graph models Terrence's movement while skateboarding.

How can you use the graph to find the skateboarder's rate during a specific time period?

7

Labelling

Fill in the table with the information from Terrence’s skateboarding.

You will use these points to calculate rates on the next page.

Drag labels to their correct position on the image

7

7

1

7

4

7

8

web page not embeddable

Agile Mind

You can open this webpage in a new tab.

9

Fill in the Blanks

10

Math Response

What is the rate for the skate modeled by this graph in feet per second?

Type answer here
Deg°
Rad

11

Drag and Drop

Question image
Here is another graph that shows Terrence's movement while skateboarding. Fill in the blanks to complete the following statements about the different rates of change you see on the graph.

a. Segment ​
shows a rate of change of 0 ft/sec.

b. Segment ​
shows a negative rate of change.

c. Segment ​
shows a positive rate of change.

d. Looking at segment A, Terrence’s rate of change for the first 2 seconds was ​
.

e Looking at segment C, Terrence’s rate of change for the last 5 seconds was ​
.
Drag these tiles and drop them in the correct blank above
B
A
C
-2 ft/sec
2/5 ft/sec
3 ft/sec
0 ft/sec
1 ft/sec
-1 ft/sec
5/2 ft/sec

12

Draw

The table shows the information for one of Terrence's skates.

Use the table to create a graph for this skate.

13

Fill in the Blanks

media image

14

Open Ended

Describe how you found the rates from the graphs.

15

Drag and Drop

Question image
Here is another graph that shows Terrence's movement while skateboarding. Can you interpret the graph to complete this puzzle about the different rates of change you see?

Segment ​
shows a rate of change of 0 ft/sec.

Segment ​
shows a negative rate of change.

Segment ​
shows a positive rate of change.

Looking at segment A, Terrence's rate of change for the first 2 seconds was ​
ft/sec.

Looking at segment C, Terrence's rate of change for the last 5 seconds was ​
ft/sec.
Drag these tiles and drop them in the correct blank above
B
A
C
-2
2/5
-1/2
2
5/2

16

Draw

The table shows the information for one of Terrence’s skates.

Time (sec) | Distance (ft)

0 | 2

1 | 4

2 | 6

3 | 8

Time (sec): 0 | 1 | 2 | 3

Distance (ft): 2 | 4 | 6 | 8

Use the table to create a graph for this skate. How fast was he skating? (answer this on the next slide)

17

Fill in the Blanks

media image

18

Drag and Drop

Question image
According to the graph, how fast were the elevators moving

Elevator A: ​
floor/sec

Elevator B: ​
floor/sec
Drag these tiles and drop them in the correct blank above
0
2
1
-1
-2

19

Drag and Drop

Question image
According to the graph, how fast were the elevators moving

Elevator A: ​
floor/sec

Elevator B: ​
floor/sec
Drag these tiles and drop them in the correct blank above
0
2
1
-1
-2

20

media

21

media

Here is a new situation involving rate. You probably know the fable The Tortoise and the Hare. With steady perseverance, the tortoise won that race. But the real story picks up after that first contest. After losing that race, the Hare challenges Tortoise to run three more 100-meter races. The winner will be the animal who wins the greatest number of races.


Complete the activity in your activity book. You will practice graphing rates as you investigate the further adventures of Tortoise and Hare.

Consolidation activity

22

Open Ended

An important idea from today’s lesson is …

23

Open Ended

Which activities from today’s lesson prepare you to successfully complete your homework?

Lesson 4: What's my rate?

By Amy Hurley

Show answer

Auto Play

Slide 1 / 23

SLIDE