Search Header Logo
STATS AND PROB - PROBLEM SET

STATS AND PROB - PROBLEM SET

Assessment

Presentation

Mathematics

6th - 8th Grade

Medium

CCSS
HSS.ID.A.4, HSS.IC.A.1, HSS.ID.B.5

+6

Standards-aligned

Created by

Rodley Lina

Used 1+ times

FREE Resource

1 Slide • 100 Questions

1

​STATS AND PROB (PROBLEM SET)

By Rodley Lina

2

Multiple Choice

Determine whether the given situation is Descriptive or Inferential Statistics.

Situation: Update on Internet restoration in your area

1

Descriptive Statistics

2

Inferential Statistics

3

Multiple Choice

The branch of Mathematics that deals with the scientific collection, organization, presentation, analysis, and interpretation of numerical data.

1

Statistics

2

Geometry

3

Analysis

4

Accounting

4

Multiple Choice

Question image

What are observations made using our five senses called?

1

qualitative data

2

quantitative data

5

Multiple Choice

Identify whether the experiment involves a discrete or a continuous random variable.

Collecting data about the mileage per liter of a certain brand and model of a car

1

Discrete Random Variable

2

Continuous Random Variable

6

Multiple Choice

Indicate which level of measurement is being used in the given scenario. 

A meteorologist compiles a list of temperatures in degrees Celsius for the month of May.

1

Nominal

2

Ordinal

3

Interval

4

Ratio

7

Multiple Choice

Indicate which level of measurement is being used in the given scenario. 

The teacher of a class of third graders records the letter grade for mathematics for each student.

1

Nominal

2

Ordinal

3

Interval

4

Ratio

8

Multiple Choice

True or false:

The social security numbers of students in a class represent quantitative data.

1

A. TRUE

2

B. FALSE

9

Multiple Choice

Identify the data set’s level of measurement:

The IQ scores of students in a class.

1

A. Nominal

2

B. Ordinal

3

C. Interval

4

D. Ratio

10

Multiple Choice

Identify the data set’s level of measurement:

The salaries of nurses at a hospital.

1

A. Nominal

2

B.Ordinal

3

C. Interval

4

D. Ratio

11

Multiple Choice

The event of selecting a month of the year with 31 days.

1

7/12

2

1/12

3

2/3

4

5/12

12

Multiple Choice

An unlikely chance event is closer to what number?
1
0
2
1
3
2
4
3

13

Multiple Choice

A bag of marbles contains 5 red, 7 purple, and 3 blue marbles. If one marble is chosen at random, what is the probability that the marble is NOT blue?
1
4/5
2
1/5
3
3/5
4
2/5

14

Multiple Select

Question image

What is the probability of spinning a 2 on the spinner?

1

1/2

2

1/3

3

1/8

4

1/4

15

Multiple Choice

A bag has 3 red marbles, 2 blue and 4 yellow. What is the probability of pulling a red?
1
3/10
2
3/9
3
1/9
4
1/3

16

Multiple Choice

Question image
Based on the chart, what is the probability of pulling a green marble?
1
1/8
2
8/25
3
8/100
4
7/8

17

Multiple Choice

Question image
A bag has 3 red marbles, 2 blue and 4 yellow. What is the theoretical probability of pulling a red?
1
3/10
2
3/9
3
1/9
4
1/3

18

Multiple Choice

If three coins are tossed, which is NOT a possible value of the random variable for the number of tails?

1

1

2

2

3

3

4

4

19

Multiple Choice

It is a variable whose value is determined by the outcome of a random procedure.

1

Random Variable

2

Discrete

3

Continuous

20

Multiple Choice

Question image

Determine whether the distribution is a probability distribution of a discrete random variable or not.

1

a probability distribution

2

not a probability distribution

21

Multiple Choice

The sum of all probabilities in a probability distribution must be equal to 1.

1

TRUE

2

FALSE

22

Multiple Choice

68% of the marks in a test are between 51 and 64

Assuming this data is normally distributed, what are the mean and standard deviation?

1

Mean = 57

S.D. = 6.5

2

Mean = 57

S.D. = 7

3

Mean = 57.5

S.D. = 6.5

4

Mean = 57.5

S.D. = 13

23

Multiple Choice

The standard normal probability distribution has mean of 0 and a standard deviation of _____.

1

12\frac{1}{2}

2

1-1

3

11

4

12-\frac{1}{2}

24

Multiple Choice

Any normal probability distribution can be converted to the standard normal probability distribution by the following formula

1

z=Xμσz=\frac{X-\mu}{\sigma}

2

z=μXσz=\frac{\mu-X}{\sigma}

3

z=X+μσz=\frac{X+\mu}{\sigma}

4

z=Xμσz=\frac{X\mu}{\sigma}

25

Multiple Choice

By standardizing a normal probability distribution, we can report the distance of a value from the mean in units of the __________ .

1

median

2

standard deviation

3

variance

4

mode

26

Multiple Choice

The signed distance between a selected value, designated X, and the mean, μ, divided by the standard deviation, σ.

1

p value

2

z value

3

r value

4

t value

27

Multiple Choice

Between what two standard deviation of normal distribution contain 68% of the data?

1

one below and one above

2

two below an zero

3

two below and two above

4

zero and two above

28

Multiple Choice

A normal distribution is symmetric.

1

True

2

False

29

Multiple Choice

Find the z-score for 75 given a mean of 60 and a standard deviation of 6.

1

-2.5

2

2.5

3

-1.15

4

1.15

30

Multiple Choice

What shape is a normal distribution curve?

1

Half curve

2

Rhombus curve

3

Bell curve

4

Square curve

31

Multiple Choice

What does the mean tell you about a data set

1

It tells you the number that occurs the most

2

It is the difference between the highest and lowest number

3

It tells you the average of the data set

4

It tells you how mad someone is at another person

32

Multiple Choice

Where can we locate the mean in the normal curve?

1

to the left portion

2

to the right portion

3

at the center

4

on the z - axis

33

Multiple Choice

Which of the following graphs shows a normal curve?

1
2
3
4

34

Multiple Choice

What is the total area under the standard normal distribution curve?

1

100

2

5

3

25

4

1

35

Multiple Choice

What is NOT true about the standard normal distribution?

1

it is bell-shaped.

2

it is asymmetrical.

3

it is unimodal

4

the mean is 0 and the standard deviation is one.

36

Multiple Choice

The z-score represents....

1

the amount of standard deviations a data value is above or below the mean.

2

the amount of standard deviations a data value is above or below the media .

3

the percentile the data value is above or below the mean.

4

the percent the data value is above or below the mean.

37

Multiple Choice

Find the area that corresponds to z = 2.31

1

0.4772

2

0.4778

3

0.4896

4

0.4893

38

Multiple Choice

Compute the area that correspond to the given:

From z = 0.1 to z = 1.6

1

1.4849

2

1.4850

3

1.4851

4

1.4852

39

Multiple Choice

Which image correspond to z = 2.75 to z = -1.75?

1
2
3
4

40

Multiple Choice

Between what two standard deviation of normal distribution contain 95% of the data?

1

one below and one above

2

two below an zero

3

two below and two above

4

zero and two above

41

Multiple Choice

Find the area under normal curve if z = -0.75 to z = -2.75.

1

0.4970

2

0.7703

3

0.7704

4

0.2734

42

Multiple Choice

Find the area under normal curve if the value of z= 0 to z = 1.84.

1

0.4670

2

0.4671

3

0.4672

4

0.4673

43

Multiple Choice

Question image

The formula in finding the mean of a discrete probability distribution is shown below.

1

TRUE

2

FALSE

44

Multiple Choice

Experiment is the set of all possible outcomes.

1

TRUE

2

FALSE

45

Multiple Choice

Question image

The example below is an example of Discrete Probability Distribution.

1

TRUE

2

FALSE

46

Multiple Choice

Question image

The value of P(3) is 3/12.

1

TRUE

2

FALSE

47

Multiple Choice

Question image

Find the mean of the given probability distribution below.

1

0.8

2

1.6

48

Multiple Choice

Question image

Determine whether the distribution is a probability distribution of a discrete random variable or not.

1

a probability distribution

2

not a probability distribution

49

Multiple Choice

Question image

Determine whether the distribution is a probability distribution of a discrete random variable or not.

1

a probability distribution

2

not a probability distribution

50

Multiple Choice

Question image

Determine whether the distribution is a probability distribution of a discrete random variable or not.

1

a probability distribution

2

not a probability distribution

51

Multiple Choice

Question image

The table shows the probability distribution of a discrete random variable "x". What is the probability of x=80 or P(80).

1

0.10

2

0.15

3

0.20

4

0.40

52

Multiple Choice

Question image

The table shows the probability distribution of a discrete random variable "x". What is the probability of x greater than 80 or P(x>80).

1

0.10

2

0.40

3

0.50

4

0.90

53

Multiple Choice

Question image

The table shows the probability distribution of a discrete random variable "x". What is the probability of x less than 80 or P(x<80).

1

0.10

2

0.40

3

0.50

4

0.90

54

Multiple Choice

Question image

The table shows the probability distribution of a discrete random variable "x". What is the probability of x less than or equals 80 or P(x80).

1

0.10

2

0.40

3

0.50

4

0.90

55

Multiple Choice

Question image

The table shows the probability distribution of the number "x" of live pups in a litter of a female not over twelve months of age that has not borne a litter in the past six weeks. Find the probability that the next litter will produce five to seven live pups.

1

0.22

2

0.26

3

0.31

4

0.79

56

Multiple Choice

Question image

The table shows the probability distribution of the number "x" of live pups in a litter of a female not over twelve months of age that has not borne a litter in the past six weeks. Find the probability that the next litter will produce at least six live pups.

1

0.22

2

0.31

3

0.60

4

0.71

57

Multiple Choice

It is repeatedly done under similar condition.

1

Sample Space

2

Experiment

3

Outcome

58

Multiple Choice

It is the result of the trial in an experiment.

1

Sample Space

2

Outcome

3

Experiment

59

Multiple Choice

It is a random variable where the observed numerical value are the results of measuring and may take on any numbers contained within any numerical intervals.

1

Continuous

2

Discrete

3

Probability

60

Multiple Choice

It is a random variable where the observed numerical value is produced by counting and assumes whole numbers only.

1

Continuous

2

Probability

3

Discrete

61

Multiple Choice

Which of the following represents a discrete random variable?

1

The weight in kilograms of randomly selected Senior High School students.

2

The time it takes a student to finish answering the midterm exams.

3

The number of patients who experience side effects after taking antibiotics.

62

Multiple Choice

Which of the following random variables is continuous

1

The number of defective cellular phones in a box of 20.

2

The time required to finish a certain job.

3

The number of correct answers in 20-item multiple choice test.

63

Multiple Select

They describe the amount of spread in a distribution.

1

Mode

2

Variance

3

Standard Deviation

4

Mean

64

Multiple Choice

It is the weighted average of the possible values that the random variable can take.

1

Mode

2

Variance

3

Standard Deviation

4

Mean

65

Multiple Choice

What can we generate if we take the squares of standard deviation?

1

Variance

2

Standard Deviation

3

Mean

4

Mode

66

Multiple Choice

Which of the following is also equal to the square root of the variance?

1

Probability

2

Statistics

3

Standard Deviation

4

Median

67

Multiple Choice

Which of the following notations is equivalent to the mean of the probability?

1


σ

2

μ

3

4

None

68

Fill in the Blanks

69

Fill in the Blanks

70

Multiple Choice
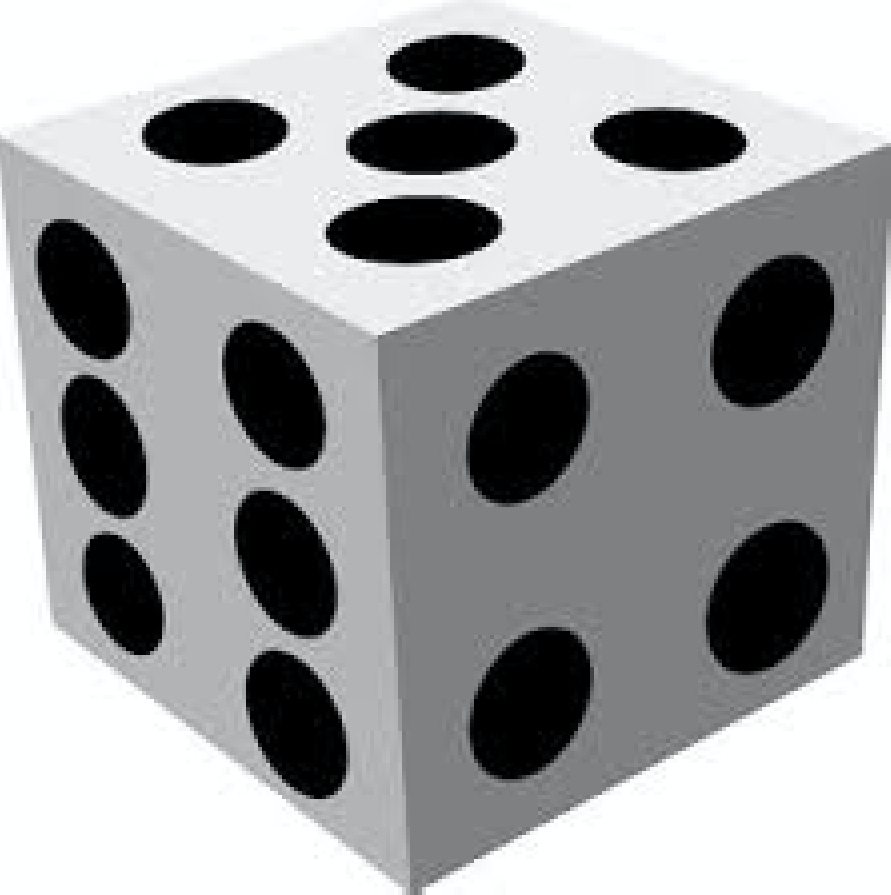
Question image
If you were to roll the die one time what is the probability of it landing on a 2?
1
2 out of 6
2
2 out of 2
3
1 out of 6
4
1 out of 1

71

Multiple Choice

Question image

If two coins are tossed once, which is NOT a possible value of the random

variable for the number of heads?

1

0

2

1

3

2

4

3

72

Multiple Choice

Question image

Which of the following is a discrete random variable?

1

Length of wire ropes

2

Number of soldiers in the troop

3

Amount of paint used in repainting the building

4

Voltage of car batteries

73

Multiple Choice

Question image

It is a numerical quantity that is assigned to the outcome of an experiment.

1

random variable

2

variable

3

probability

4

probability distribution

74

Multiple Choice

Question image

The number of winners in lotto for each day

1

discrete

2

continuous

75

Multiple Choice

Question image

The area of lots in an exclusive subdivision

1

discrete

2

continuous

76

Multiple Choice

Question image

The speed of a car

1

discrete

2

continuous

77

Multiple Choice

Question image

The number of dropouts in a school per school

1

discrete

2

continuous

78

Multiple Choice

Question image

The weight of the professional wrestlers

1

discrete

2

continuous

79

Multiple Choice

When a single die is rolled, find the probability of getting an 8.

1

3/8

2

1

3

1/6

4

0

80

Multiple Choice

there are 20 marbles in a container: 4 are red, 5 are blue and 11 are yellow. What is rthe probability that a yellow marble will be picked?

1

1/5

2

11/20

3

9/11

4

1/4

81

Multiple Choice

The third person to knock on the door will be a female.

1

2/3

2

1/4

3

1/2

4

1/3

82

Multiple Choice

When a card is drawn from the set of 52 cards, it shows a black heart.

1

0

2

1/2

3

1

4

1/4

83

Multiple Choice

When a card is drawn from the standard deck of 52 cards, it shows a red ace.

1

1/26

2

1/13

3

3/52

4

1/4

84

Multiple Choice

If 3 coins are flipped together, the third coin shows a head.

1

7/8

2

1/2

3

3/8

4

1/4

85

Multiple Choice

In a family of 3 children, the eldest child is a boy.

1

1/4

2

1/2

3

2/3

4

1

86

Multiple Choice

When a die is rolled, it shows a counting number less than 7.

1

2/3

2

1

3

1/2

4

0

87

Multiple Choice

When a die is rolled, the die shows a composite number.

1

2/3

2

1/6

3

1/3

4

1/2

88

Multiple Choice

Determine whether the given situation is Descriptive or Inferential Statistics.

Situation: The Effects of Typhoon Odette in the lives of the people.

1

Descriptive Statistics

2

Inferential Statistics

89

Multiple Choice

Determine whether the given situation is Descriptive or Inferential Statistics.

Situation: The percentage of the examinees passing the licensure exam.

1

Descriptive Statistics

2

Inferential Statistics

90

Multiple Choice

Determine whether the given situation is Descriptive or Inferential Statistics.

Situation: Health benefits of having a healthy lifestyle.

1

Descriptive Statistics

2

Inferential Statistics

91

Multiple Choice

Determine whether the given situation is Descriptive or Inferential Statistics.

Situation: Literacy rate of the Filipino people at present.

1

Descriptive Statistics

2

Inferential Statistics

92

Multiple Choice

Determine whether the given data is Qualitative or Quantitative.

Data: Mode of payment for the tuition (cash, check, online)

1

Qualitative Data

2

Quantitative Data

93

Multiple Choice

Determine whether the given data is Qualitative or Quantitative.

Data: Annual sales in the company

1

Qualitative Data

2

Quantitative Data

94

Multiple Choice

Determine whether the given data is Qualitative or Quantitative.

Data: Monthly salary 

1

Qualitative Data

2

Quantitative Data

95

Multiple Choice

Determine whether the given data is Qualitative or Quantitative.

Data: Glass size for Milk tea

1

Qualitative Data

2

Quantitative Data

96

Multiple Choice

Determine whether the given data is Qualitative or Quantitative.

Data: Employee classification (Permanent, Part-time, Probationary)

1

Qualitative Data

2

Quantitative Data

97

Multiple Choice

Determine whether the given data is Discrete or Continuous.

Data: Population in Cebu City

1

Discrete Data

2

Continuous Data

98

Multiple Choice

Determine whether the given data is Discrete or Continuous.

Data: The number of words in a book.

1

Discrete Data

2

Continuous Data

99

Multiple Choice

Determine whether the given data is Discrete or Continuous.

Data: Monthly net income of an employee

1

Discrete Data

2

Continuous Data

100

Multiple Choice

Determine whether the given data is Discrete or Continuous.

Data: The number of clothes in your closet

1

Discrete Data

2

Continuous Data

101

Multiple Choice

Determine whether the given data is Discrete or Continuous.

Data: Person's weight

1

Discrete Data

2

Continuous Data

​STATS AND PROB (PROBLEM SET)

By Rodley Lina

Show answer

Auto Play

Slide 1 / 101

SLIDE