
Populations Notes - EES

Presentation
•
Science
•
9th - 12th Grade
•
Practice Problem
•
Medium
+6
Standards-aligned

Ben Schosek
Used 1+ times
FREE Resource
31 Slides • 22 Questions
1

2
Multiple Choice
How do births, deaths, immigration, and emigration affect the size of a population?
Births and immigration increase population size, while deaths and emigration decrease it.
Births and emigration increase population size, while deaths and immigration decrease it.
Births and deaths increase population size, while immigration and emigration decrease it.
Deaths and immigration increase population size, while births and emigration decrease it.
3

4
Multiple Choice
Which of the following best describes the difference between specialist and generalist species?
Specialist species thrive in a wide range of environments, while generalist species are limited to specific habitats.
Specialist species have a narrow diet and habitat preference, while generalist species can adapt to a variety of foods and environments.
Generalist species are always endangered, while specialist species are always common.
Specialist species migrate frequently, while generalist species do not migrate.
5

6
Multiple Choice
Which of the following best describes a specialist species?
Has a broad range of food requirements and high adaptability
Has a narrow ecological niche and specific food requirements
Is less likely to become extinct due to high adaptability
Uses a variety of resources and adapts to many environments
7

8
Open Ended
Compare the adaptability of specialist and generalist species when environmental conditions change.
9

10
Open Ended
Identify ONE characteristic of specialist species and explain how that characteristic makes them more likely to become extinct than generalist species.
11

12

13

14
Fill in the Blanks
K-selected species typically have
15

16
Multiple Choice
Which organism on the spectrum produces the highest number of offspring per year?
Oyster
Fish (Tuna)
Frog
Chimpanzee
17

18
Open Ended
Compare the parental care strategies of the hare and the frog as shown in the images.
19

20
Multiple Choice
Which of the following is NOT a characteristic of K-selected species?
High parental care
Low biotic potential
Rapid population recovery after disturbance
More likely to go extinct
21

22
Open Ended
Describe the relationship between Zebra Mussel and Unionid Mussel population density in the Hudson River.
23

24

25

26
Open Ended
Compare and contrast the survivorship patterns of Type II and Type III organisms. What ecological factors might contribute to these differences?
27
Multiple Choice
Which type of survivorship curve is characterized by high survivorship early in life and a rapid decrease in old age?
Type I
Type II
Type III
Type IV
28

29
Open Ended
Describe the trend in survivorship shown in this graph. Justify which type of survivorship curve these data represent.
30

31

32

33
Multiple Choice
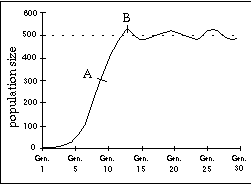
What is the carrying capacity of the graph?
around 500
more than 800
less than 300
around 700
34
Multiple Select
Which of the following are limiting resources that determine carrying capacity in an ecosystem?
Food
Water
Available Habitat
Sunlight
35

36
Multiple Choice
Which factor led to the population crash of reindeer on St. Paul Island after their exponential growth?
Predation by wolves
Overshooting carrying capacity and resource depletion
Disease outbreak
Climate change
37

38
Multiple Select
Based on the hare and lynx population graph, which of the following statements are correct?
Hare population increases when lynx population is low.
Lynx population increases due to an increase in hare population.
Increasing lynx population leads to hare population die-off.
Hare population remains constant regardless of lynx population.
39

40
Open Ended
Explain the impact that the canine virus had on the moose population based on the graph.
41

42

43
Fill in the Blanks
A population with a high density is more likely to experience a
44

45
Multiple Choice
Which of the following is a density-independent factor that can limit population growth?
Competition for food
Disease outbreak
Natural disasters
Predation
46

47

48

49

50

51

52
Multiple Choice

This population pyramid shows...
Rapid growth
Slow growth
Negative growth
53
Open Ended
Reflecting on today's lesson, what questions do you still have about the differences between specialist and generalist species, or how these differences impact their survival in changing environments?
Show answer
Auto Play
Slide 1 / 53
SLIDE
Similar Resources on Wayground

51 questions
Environmental & Earth Systems Final Fall
Presentation
•
8th - 12th Grade
45 questions
Ecology
Presentation
•
9th Grade - University
52 questions
Population Ecology
Presentation
•
9th - 12th Grade
52 questions
Biodiversity Biology
Presentation
•
9th - 12th Grade
47 questions
Español 3 Unidad 3, Lección 1
Presentation
•
9th - 12th Grade
51 questions
Stream ecology - inverts
Presentation
•
9th Grade - University
46 questions
ES Semester 1 Review
Presentation
•
9th - 12th Grade
46 questions
Biotech Wrap Up
Presentation
•
9th - 12th Grade
Popular Resources on Wayground
10 questions
How much do you know about our Portrait of an Eagle?

Quiz
•
10th Grade
10 questions
Fast Food Slogans
Quiz
•
6th - 8th Grade
21 questions
Continents and Oceans
Quiz
•
6th Grade
20 questions
Parts of Speech
Quiz
•
5th Grade
16 questions
Subject & Predicate
Quiz
•
5th Grade
25 questions
Multiplication Facts
Quiz
•
5th Grade
12 questions
Map Skills
Quiz
•
3rd Grade
22 questions
Continents and Oceans
Quiz
•
5th Grade
Discover more resources for Science
10 questions
Exploring Chemical and Physical Changes

Interactive video
•
6th - 10th Grade
20 questions
Atomic Structure
Quiz
•
9th Grade
10 questions
Decoding the Periodic Table of Elements
Interactive video
•
6th - 10th Grade
10 questions
Exploring the Periodic Table
Interactive video
•
6th - 10th Grade
14 questions
Physical and Chemical Changes
Quiz
•
10th Grade
22 questions
Periodic Table Review
Quiz
•
9th - 12th Grade
20 questions
Observation vs. Inference
Quiz
•
7th - 9th Grade
14 questions
Periodic Trends
Interactive video
•
11th Grade