Search Header Logo
A1 Exponential Regression M4T2- L3

A1 Exponential Regression M4T2- L3

Assessment

Presentation

Mathematics

9th - 12th Grade

Medium

CCSS
HSF.LE.A.1, HSS.ID.B.6, HSF.LE.A.2

+4

Standards-aligned

Created by

Savanna Paiva

Used 1+ times

FREE Resource

8 Slides • 8 Questions

1

media

2

media

3

media

4

media

5

media

6

media

7

media

8

media

9

Multiple Choice

Question image

Which exponential function represents this table?

1
y=512(1/4)x
2
y=32(4)x
3
y=32(1/4)x
4
y=512(4)x

10

Multiple Choice

Question image

Write the exponential regression equation for the data.

1

Y=8.16(2.7)x

2

Y=81.6(2.7)x

3

Y=8.16(.27)x

4

Y=8.16(27)x

11

Math Response

The breaking strength, y, in tons, of steel cable with diameter d, in inches, is given in the table.

Write an exponential regression equation.

Round to the nearest hundredth

Type answer here
Deg°
Rad

12

Multiple Choice

Question image

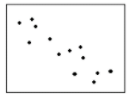
Which type of regression model does the scatter plot appear to show?

1

linear

2

exponential

3

quadratic

13

Multiple Choice

Question image
A chemist has a 100-gram sample of a radioactive material.  He records the amount of radioactive material every week for 6 weeks and obtains the following data: Find the exponential model of the function.
1
y = 100(8.7)x
2
y = 100(1.87)x
3
y = 100(.87)x
4
y = 100(.13)x

14

Multiple Choice

Question image
What kind of correlation?
1
Positive
2
Negative
3
No

15

Multiple Choice

Question image
What kind of correlation?
1
Positive
2
Negative
3
No

16

Math Response

A box containing 1,000 coins is shaken, and the coins are emptied onto a table. Only the coins that land heads up are returned to the box, and then the process is repeated. The accompanying table shows the number of trials and the number of coins returned to the box after each trial.

Write an exponential regression equation that represents the table.

Type answer here
Deg°
Rad
media

Show answer

Auto Play

Slide 1 / 16

SLIDE