Search Header Logo
Absent notes  U6 D5 Slide Deck Evolutionary Change

Absent notes U6 D5 Slide Deck Evolutionary Change

Assessment

Presentation

Biology

9th Grade

Practice Problem

Medium

NGSS
HS-LS4-1, HS-LS4-2, HS-LS4-4

+5

Standards-aligned

Created by

Jessica Goff

Used 1+ times

FREE Resource

29 Slides • 26 Questions

1

media

2

media

3

media

4

media

5

Fill in the Blanks

6

media

7

media

8

Open Ended

Explain how modern DNA technologies have transformed our understanding of evolutionary change compared to early methods based on physical characteristics.

9

Multiple Choice

Which DNA technology allows scientists to amplify (copy) specific DNA sequences for study?

1

DNA sequencing

2

Polymerase Chain Reaction (PCR)

3

Genetic Mapping

4

Comparing Genomics

10

media

11

Multiple Choice

What is the evolutionary significance of mutation analysis?

1

It shows genetic relationships between species

2

It reveals common ancestry

3

It measures genetic changes over time

4

It helps determine when species diverged

12

Multiple Select

Select all evidence types that help reveal common ancestry and evolutionary divergence.

1

DNA Sequencing

2

Comparing Genomics

3

Mutation Analysis

4

Physical Characteristics

13

media

14

Open Ended

Question image

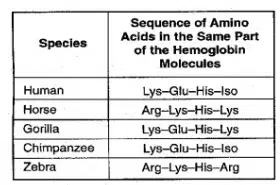
Based on the amino acid sequences, what can be inferred about the evolutionary relationship of the human and the chimpanzee? Why?

15

media

16

Open Ended

What evidence supports your answer about which two species have a strong evolutionary relationship?

17

Multiple Choice

Based on the number of amino acid substitutions, which two species have a strong evolutionary relationship (or share a similar evolutionary history)?

1

A and B

2

B and C

3

A and D

4

D and B

18

media

19

Multiple Choice

Which species share more evolutionary history according to the number of similarities in a specific gene?

1

B and C

2

C and D

3

A and E

4

D and E

20

media

21

Multiple Choice

Which species show the biggest difference in their evolutionary history according to the number of differences in a specific gene?

1

Species 1 and 4

2

Species 2 and 4

3

Species 3 and 4

4

Species 4 and 5

22

media

23

Fill in the Blanks

Type answer...

24

media

25

media

26

Open Ended

Explain how phylogenetic trees and cladograms help scientists represent evolutionary relationships.

27

media

28

Multiple Choice

Which of the following is NOT a characteristic of a cladogram or phylogenetic tree?

1

Shows evolutionary relationships

2

Based on DNA analysis and fossil discovery

3

Shows common ancestors and shared traits

4

Shows the geographic location of species

29

media

30

media

31

Open Ended

Explain how branching points (nodes) in a cladogram or phylogenetic tree help scientists understand evolutionary relationships.

32

media

33

Fill in the Blanks

Type answer...

34

Multiple Select

Select all the features that are used to determine evolutionary relationships in a cladogram.

1

DNA analysis

2

Shared traits

3

Geographic location

4

Speciation

35

media

36

Open Ended

How does the process of speciation lead to the formation of new species according to the diagrams?

37

media

38

Fill in the Blanks

Type answer...

39

media

40

Multiple Choice

Which colored box represents the ancestor of all species?

1

Green

2

Blue

3

Orange

4

None

41

Multiple Choice

Which two species share a most recent common ancestor?

1

A and B

2

B and C

3

A and C

4

A and B and C

42

media

43

Fill in the Blanks

Type answer...

44

media

45

Open Ended

Explain how a phylogenetic tree can be used to determine evolutionary relationships between organisms shown in images 2 and 3.

46

Multiple Choice

Which organism is most closely related to the snake?

1

Fish

2

Mammal

3

Lizard

4

Tuatara

47

media

48

Multiple Choice

What number is the common ancestor of C and D?

1

1

2

3

3

2

4

4

49

media

50

media

51

media

52

media

53

media

54

Multiple Choice

What is one way evolutionary relationships can be represented, according to today's learning target?

1

Using branching tree diagrams called cladograms and phylogenetic trees

2

Using Punnett squares

3

Using bar graphs

4

Using pie charts

55

Open Ended

How do you think advancements in genetic technology have impacted our understanding of species change over time?

media

Show answer

Auto Play

Slide 1 / 55

SLIDE