
Interpreting Data Charts 101 - MR H
Presentation
•
Mathematics
•
6th - 8th Grade
•
Practice Problem
•
Easy
+9
Standards-aligned

DWAYNE HAUPT
Used 6+ times
FREE Resource
8 Slides • 26 Questions
1

2
Multiple Choice
3

4
Multiple Choice
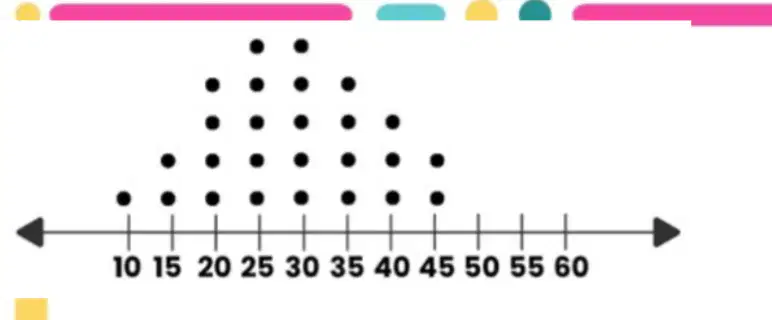
What are the minimum, maximum, mode, range values, and distribution represented in the diagram?
5

6
Multiple Choice
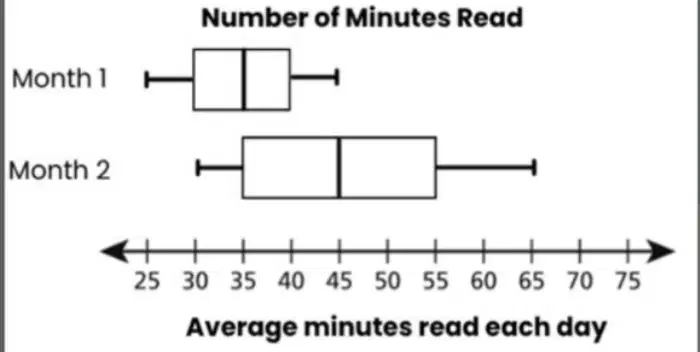
Median for month 1:
7
Multiple Choice
Median for month 2:
8
Multiple Choice
What is the difference in the minimum between month 1 and month 2?
9
Open Ended
Which month has a wider range of data? How do you know?
10

11
Multiple Choice
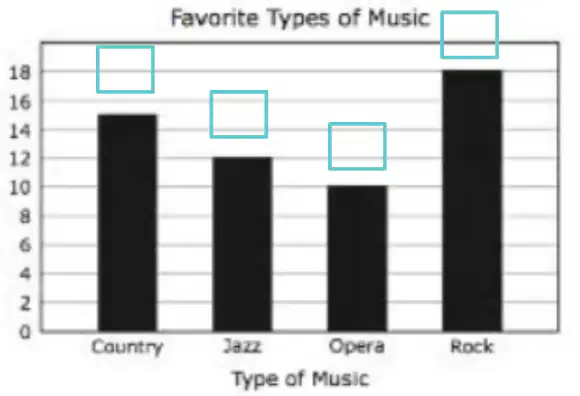
How many total people were surveyed?
12
Multiple Choice
Based on the bar graph how many people have their favorite music as.....Country, Jazz, Opera, Rock?
13
Multiple Choice

How many people did NOT like Jazz or Opera?
14
Multiple Choice

True or False: More people liked country and Jazz then liked Opera and rock
15

16
Multiple Choice

How many students studied for less than 5 hours?
17
Multiple Choice

What is the fewest number of hours studied by the students?
18
Multiple Choice

What is the maximum number of hours studied by the students?
19
Multiple Choice

How many students studied for 9 hours?
20
Multiple Choice

How many students studied for less than 6 hours?
21

22
Multiple Choice
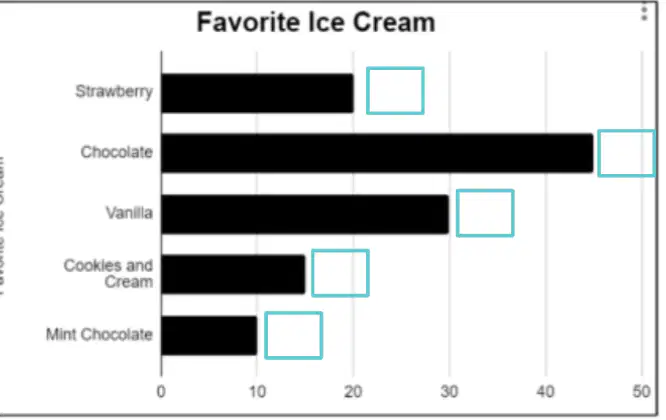
Total people for each flavor?
23
Multiple Choice
How many people did NOT like chocolate or vanilla?
24
Multiple Choice

How many total people were surveyed for their favorite ice cream flavor?
25
Multiple Choice
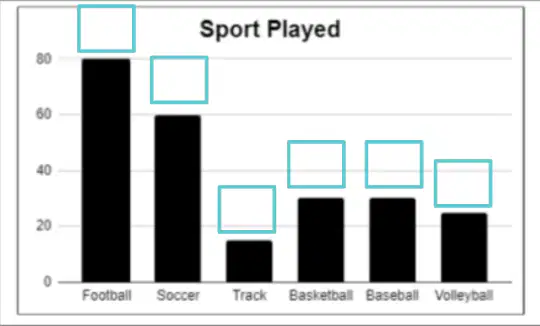
What is the most common sport played among the students?
26

27
Multiple Choice
Total # of students?
28
Multiple Choice
Number students who play football or volleyball?
29
Multiple Choice
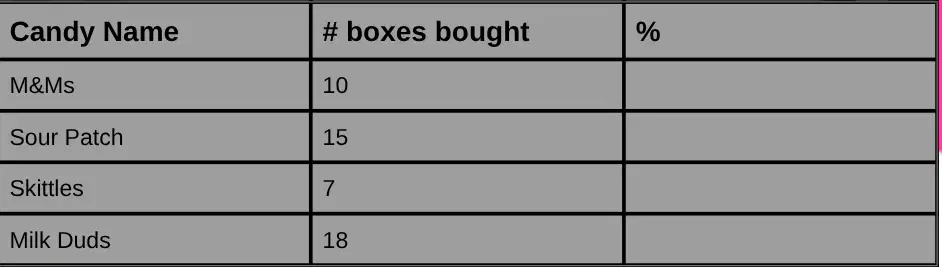
What is the percentage of boxes sold for M&M candy based on the data provided?
30

31
Multiple Choice

What is the percentage of boxes sold for Sour Patch candy based on the data provided?
32
Multiple Choice

What is the percentage of boxes sold for Skittles candy based on the data provided?
33
Multiple Choice

What is the percentage of boxes sold for Milk Duds candy based on the data provided?
34
Poll
Show answer
Auto Play
Slide 1 / 34
SLIDE
