3-6: Sketch Functions From Verbal Descriptions
Authored by Sean Mcgrail
Mathematics
8th Grade
CCSS covered
Used 36+ times

AI Actions
Add similar questions
Adjust reading levels
Convert to real-world scenario
Translate activity
More...
Content View
Student View
45 questions
Show all answers
1.
MULTIPLE CHOICE QUESTION
2 mins • 1 pt

The graph shows how a motorboat travels around a lake. What does the graph most likely show?
The boat travels at a constant speed for 10 minutes and then stops.
The boat travels at a constant speed for 10 minutes and then slows down.
The boat steadily increases its speed for 10 minutes and then stops.
The boat steadily increases its speed for 10 minutes and then travels at a constant speed.
Tags
CCSS.HSF.IF.B.4
2.
MULTIPLE CHOICE QUESTION
2 mins • 1 pt
The value of a stock decreases sharply for 2 weeks, then increases sharply for 1 week,
and then decreases sharply again for 2 weeks.
Which graph shows the relationship between the value of the stock and time?


Tags
CCSS.HSF.IF.B.4
3.
MULTIPLE CHOICE QUESTION
2 mins • 1 pt
Mr. Harris attaches a full tank of propane to his grill. Then he turns on the grill and cooks food for a barbecue.
Which graph shows the relationship between the amount of propane in the tank and time?


Tags
CCSS.8.EE.B.5
4.
MULTIPLE CHOICE QUESTION
2 mins • 1 pt
Liana hikes slowly away from her campsite for 30 minutes. Then she rests for 10 minutes.
Finally she hikes back to her campsite at a faster pace, reaching it in 20 minutes.
Which graph could represent Liana's distance from the campsite and time?


Tags
CCSS.HSF.IF.B.4
5.
MULTIPLE CHOICE QUESTION
2 mins • 1 pt
A basketball player throws a ball upward from her hands, which are 5 feet above the ground.
The basketball reaches a maximum height, and then gets stuck in the net.
Which graph could represent the relationship between the height of the ball and time?


Tags
CCSS.HSF-IF.C.7A
6.
MULTIPLE CHOICE QUESTION
45 sec • 1 pt
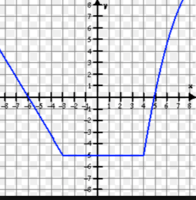
Over what interval is this function constant?
Tags
CCSS.HSF-IF.C.7B
7.
MULTIPLE CHOICE QUESTION
1 min • 1 pt

Over which interval of time is this person returning home?
Tags
CCSS.HSF.IF.B.4


Access all questions and much more by creating a free account
Create resources
Host any resource
Get auto-graded reports
Continue with Google

Continue with Email
Continue with Classlink
Continue with Clever
or continue with
Microsoft
%20(1).png)
Apple
Others
Already have an account?
