7th Grade Math State Test Review 2019
Authored by Randee Johnson
7th Grade
CCSS covered
Used 572+ times

AI Actions
Add similar questions
Adjust reading levels
Convert to real-world scenario
Translate activity
More...
Content View
Student View
16 questions
Show all answers
1.
MULTIPLE CHOICE QUESTION
3 mins • 1 pt


Tags
CCSS.7.NS.A.1C
2.
MULTIPLE CHOICE QUESTION
3 mins • 1 pt
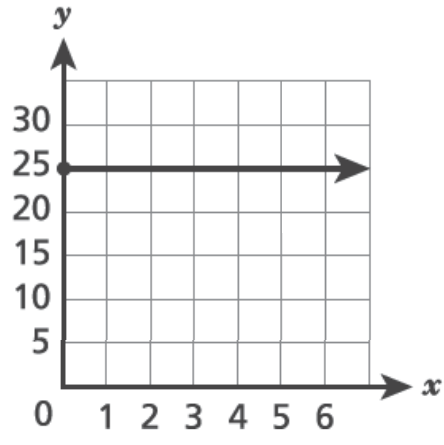
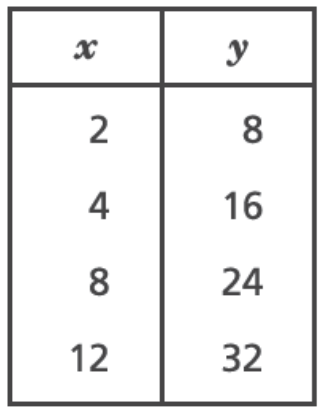
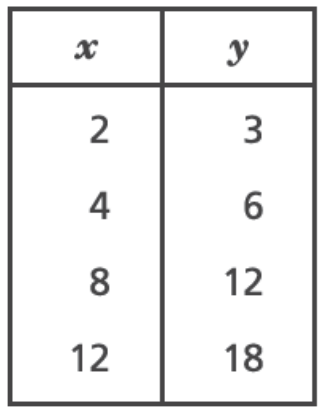
Which representation shows a proportional relationship between x and y?

Tags
CCSS.7.RP.A.2D
3.
MULTIPLE CHOICE QUESTION
30 sec • 1 pt
If the expression below has a positive value, which inequality represents all possible values of x in the expression?
-3x
x < 0
x > 0
x ≤ 0
x ≥ 0
Tags
CCSS.6.EE.B.8
4.
MULTIPLE CHOICE QUESTION
30 sec • 1 pt
Which statement describes the decimal equivalent of 7/8?
It is a decimal with a repeating digit of 5.
It is a decimal with repeating digits of 75.
It is a decimal that terminates after 2 decimal places.
It is a decimal that terminates after 3 decimal places.
Tags
CCSS.7.NS.A.2D
CCSS.8.NS.A.1
5.
MULTIPLE CHOICE QUESTION
30 sec • 1 pt


Tags
CCSS.6.EE.A.3
6.
MULTIPLE CHOICE QUESTION
30 sec • 1 pt

What is the actual area, in square meters, of this field?
8.75
17.5
35
70
Tags
CCSS.HSG.GPE.B.7
7.
MULTIPLE CHOICE QUESTION
30 sec • 1 pt

A bowling team participates in a two-day tournament and records the scores for each team member on both days. The scores for both days are represented by the box plots below.
Which conclusions can be drawn from the box plots?
The scores on Friday and the scores on Saturday have the same median and interquartile range.
The scores on Friday have a greater median and a greater interquartile range than the scores on Saturday.
The scores on Friday have a greater interquartile range than the scores on Saturday, but both data sets have the same median.
The scores on Friday have a greater median than the scores on Saturday, but both data sets have the same interquartile range.
Tags
CCSS.7.SP.B.4


Access all questions and much more by creating a free account
Create resources
Host any resource
Get auto-graded reports
Continue with Google

Continue with Email
Continue with Classlink
Continue with Clever
or continue with
Microsoft
%20(1).png)
Apple
Others
Already have an account?
