Statistics Review
Authored by Melba Gomez
Mathematics
9th Grade
CCSS covered
Used 8+ times

AI Actions
Add similar questions
Adjust reading levels
Convert to real-world scenario
Translate activity
More...
Content View
Student View
19 questions
Show all answers
1.
MULTIPLE CHOICE QUESTION
1 min • 1 pt

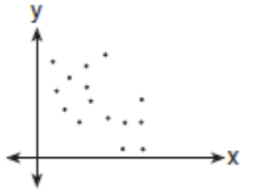
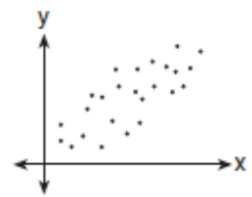
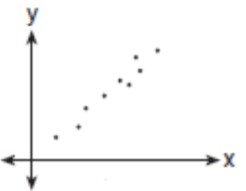
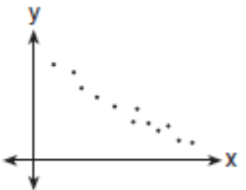
Estimate the correlation coefficient for this scatterplot.
A) r = -0.9
B) r = 1
C) r = 0.9
D) r = -1
Tags
CCSS.HSS.ID.B.6
CCSS.HSS.ID.C.8
2.
MULTIPLE CHOICE QUESTION
30 sec • 1 pt
Which of the following statements is true?
The correlation coefficient and the slope of the regression line may have opposite signs.
A correlation of 1 indicates a strong relationship between the variables.
Correlations of +0.87 and -0.87 indicate the same degree of clustering around the regression line.
A correlation of 0 shows little or no association between two variables.
Tags
CCSS.HSF.LE.B.5
3.
MULTIPLE CHOICE QUESTION
45 sec • 1 pt
Is r = -0.87 strong, moderate, or weak?
strong
moderate
weak
Tags
CCSS.HSS.ID.B.6
CCSS.HSS.ID.C.8
4.
MULTIPLE CHOICE QUESTION
30 sec • 1 pt
A study compared the number of years of education and a person's annual salary. The correlation coefficient of the data was r = 0.913. Which conclusion can be made using the correlation coefficient?
There is a strong positive correlation.
There is a strong negative correlation.
There is no correlation.
There is a weak positive correlation.
Tags
CCSS.HSS.ID.C.8
5.
MULTIPLE CHOICE QUESTION
30 sec • 1 pt

What COULD be the approximate value of the correlation coefficient for the scatter plot?
-.851
-.162
0.211
0.905
Tags
CCSS.HSS.ID.B.6
CCSS.HSS.ID.C.8
6.
MULTIPLE CHOICE QUESTION
30 sec • 1 pt
Which value of r represents data with a strong negative correlation between two data sets?
-1.07
-0.89
-0.14
0.92
Tags
CCSS.HSF-LE.A.1B
7.
MULTIPLE CHOICE QUESTION
30 sec • 1 pt
Which graph represents data that has a correlation coefficient close to -1?


Tags
CCSS.HSS.ID.B.6
CCSS.HSS.ID.C.8
Access all questions and much more by creating a free account
Create resources
Host any resource
Get auto-graded reports

Continue with Google

Continue with Email

Continue with Classlink

Continue with Clever
or continue with

Microsoft
%20(1).png)
Apple
Others
Already have an account?
Similar Resources on Wayground

15 questions
Year 10 Solving Equations
Quiz
•
9th - 11th Grade

20 questions
Me divierto con las Matemáticas LILEGRE 8° y 9° 2020.
Quiz
•
1st Grade - University

20 questions
Thử thách Toán Tuần 11
Quiz
•
5th Grade - University

20 questions
1G Multiplication & Division (Negatives)
Quiz
•
8th - 10th Grade

15 questions
KUIZ PANTAS KALKULATOR
Quiz
•
7th - 9th Grade

20 questions
Quiz de fin d'année pour les 3e
Quiz
•
9th Grade

15 questions
Equivalent Fraction
Quiz
•
5th Grade - University

20 questions
Matriks 1DVM
Quiz
•
7th - 12th Grade
Popular Resources on Wayground

7 questions
History of Valentine's Day
Interactive video
•
4th Grade

15 questions
Fractions on a Number Line
Quiz
•
3rd Grade

20 questions
Equivalent Fractions
Quiz
•
3rd Grade

25 questions
Multiplication Facts
Quiz
•
5th Grade

22 questions
fractions
Quiz
•
3rd Grade

15 questions
Valentine's Day Trivia
Quiz
•
3rd Grade

20 questions
Main Idea and Details
Quiz
•
5th Grade

20 questions
Context Clues
Quiz
•
6th Grade
Discover more resources for Mathematics

20 questions
Graphing Inequalities on a Number Line
Quiz
•
6th - 9th Grade

20 questions
Exponent Properties
Quiz
•
9th Grade

15 questions
Combine Like Terms and Distributive Property
Quiz
•
8th - 9th Grade

20 questions
Function or Not a Function
Quiz
•
8th - 9th Grade

10 questions
Factor Quadratic Expressions with Various Coefficients
Quiz
•
9th - 12th Grade

10 questions
Elijah McCoy: Innovations and Impact in Black History
Interactive video
•
6th - 10th Grade

21 questions
Factoring Trinomials (a=1)
Quiz
•
9th Grade

5 questions
Triangle Congruence Theorems
Interactive video
•
9th - 12th Grade


