Supply
Authored by Jana Lane
Social Studies
12th Grade
Used 4+ times

AI Actions
Add similar questions
Adjust reading levels
Convert to real-world scenario
Translate activity
More...
Content View
Student View
12 questions
Show all answers
1.
MULTIPLE CHOICE QUESTION
30 sec • 1 pt
When producers offer more of a good as its price increases and less as its price falls, this defines the
law of demand
law of supply
change in demand
change in supply
2.
MULTIPLE CHOICE QUESTION
30 sec • 1 pt
The willingness and ability of a producer to make a product is referred to as
quantity supplied
quantity demanded
supply
demand
3.
MULTIPLE CHOICE QUESTION
30 sec • 1 pt
Movement along a supply curve demonstrates
a change in quantity supplied
a change in quantity demanded
a change in supply
a change in demand
4.
MULTIPLE CHOICE QUESTION
30 sec • 1 pt
A shift in a supply curve demonstrates
a change in quantity supplied
a change in quantity demanded
a change in supply
a change in demand
5.
MULTIPLE CHOICE QUESTION
30 sec • 1 pt
A decrease in supply is demonstrated by which of the following?


6.
MULTIPLE CHOICE QUESTION
30 sec • 1 pt
A hurricane wipes out an orange crop in Florida, sharply affecting the supply of oranges. Which chart demonstrates this concept?


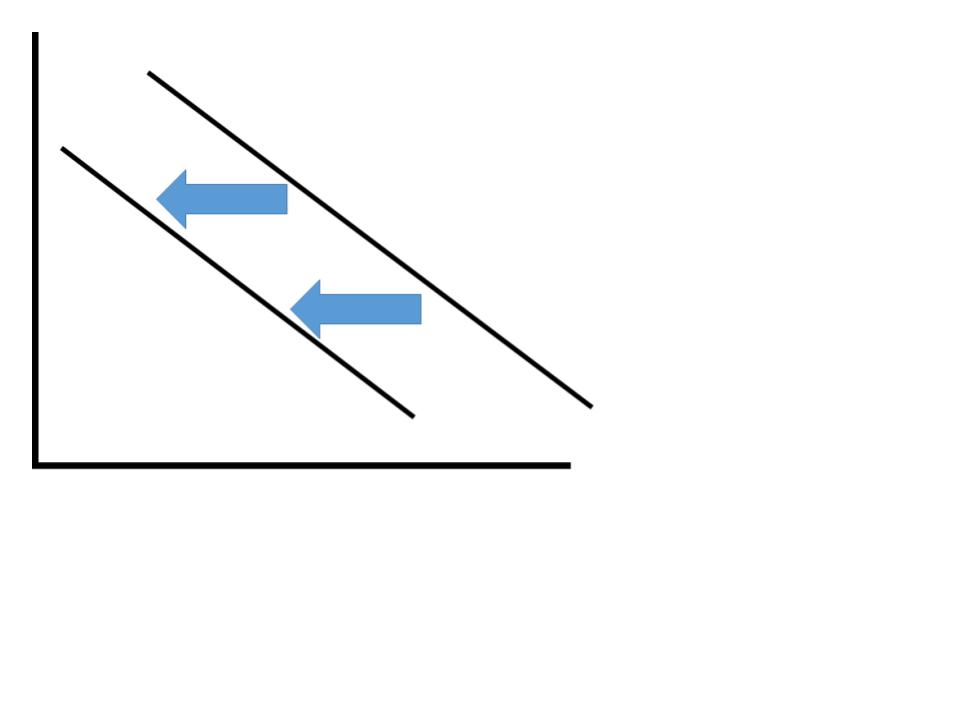
7.
MULTIPLE CHOICE QUESTION
1 min • 1 pt

The diagram represents a(n)


Access all questions and much more by creating a free account
Create resources
Host any resource
Get auto-graded reports
Continue with Google

Continue with Email
Continue with Classlink
Continue with Clever
or continue with
Microsoft
%20(1).png)
Apple
Others
Already have an account?
Similar Resources on Wayground

15 questions
Body Language
Quiz
•
12th Grade
14 questions
Aristóteles - Intro. a la Filo.
Quiz
•
12th Grade
10 questions
CURRENCY
Quiz
•
1st Grade - University
17 questions
Fundamental Rights Bharat #12
Quiz
•
7th - 12th Grade
15 questions
JURNAL PENYESUAIAN DAN KERTAS KERJA
Quiz
•
12th Grade
10 questions
Ashoka the emperor that gave up war
Quiz
•
6th Grade - University
10 questions
RF - FILOSOFIA - 2 ANO
Quiz
•
12th Grade
10 questions
World Trade Organization
Quiz
•
9th Grade - Professio...
Popular Resources on Wayground
15 questions
Fractions on a Number Line
Quiz
•
3rd Grade
20 questions
Equivalent Fractions
Quiz
•
3rd Grade
25 questions
Multiplication Facts
Quiz
•
5th Grade
54 questions
Analyzing Line Graphs & Tables
Quiz
•
4th Grade
22 questions
fractions
Quiz
•
3rd Grade
20 questions
Main Idea and Details
Quiz
•
5th Grade
20 questions
Context Clues
Quiz
•
6th Grade
15 questions
Equivalent Fractions
Quiz
•
4th Grade
Discover more resources for Social Studies
18 questions
Early civil rights and African Americans
Quiz
•
9th - 12th Grade
20 questions
Unit 7.1 The Industrial Revolution
Quiz
•
9th - 12th Grade
13 questions
USHC 3 to North and South Advantages
Quiz
•
11th - 12th Grade
30 questions
AP Psychology: Social Psychology (4.1-4.3) Quiz
Quiz
•
12th Grade
52 questions
Unit 2 Economics (Micro and Market Structures)
Quiz
•
11th - 12th Grade
73 questions
AP Psychology - Developmental Psychology
Quiz
•
10th - 12th Grade
15 questions
PFLE: Unit 2 Review
Quiz
•
12th Grade
30 questions
Full test Unit 4: Industrial Revolution
Quiz
•
9th - 12th Grade