Pie Graph
Authored by Arianne Paulino
Mathematics
6th Grade
CCSS covered
Used 612+ times

AI Actions
Add similar questions
Adjust reading levels
Convert to real-world scenario
Translate activity
More...
Content View
Student View
10 questions
Show all answers
1.
MULTIPLE CHOICE QUESTION
1 min • 1 pt

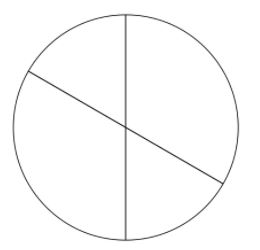
What type of graph is shown?
pictograph
stem and leaf
pie chart
histogram
Tags
CCSS.4.MD.B.4
2.
MULTIPLE CHOICE QUESTION
1 min • 1 pt

According to this circle graph, what is the least popular flavor of Jolly Rancher?
Tags
CCSS.2.MD.D.9
3.
MULTIPLE CHOICE QUESTION
1 min • 1 pt

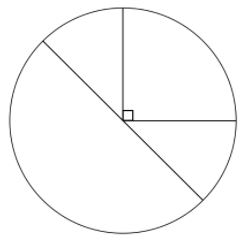
What percent of the graph is red?
50
25
75
360
4.
MULTIPLE CHOICE QUESTION
1 min • 1 pt

60 people were surveyed. How many liked red?
25
10
30
15
Tags
CCSS.6.RP.A.3C
5.
MULTIPLE CHOICE QUESTION
1 min • 1 pt
What is a Pie Graph?
A graph that uses pictures of pie to display data.
A graph that uses bars to display data
A graph that is shaped like a circle to display data
Tags
CCSS.6.SP.B.4
6.
MULTIPLE CHOICE QUESTION
1 min • 1 pt
25% of a circle is equal to:
one-fifth
a quarter
a half
two fifth
Tags
CCSS.6.NS.A.1
7.
MULTIPLE CHOICE QUESTION
1 min • 1 pt

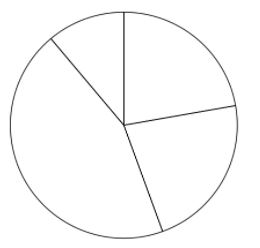
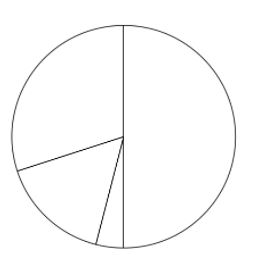
Which pie chart represents the same data as the table?


Tags
CCSS.2.MD.D.9
Access all questions and much more by creating a free account
Create resources
Host any resource
Get auto-graded reports

Continue with Google

Continue with Email

Continue with Classlink

Continue with Clever
or continue with

Microsoft
%20(1).png)
Apple
Others
Already have an account?
Similar Resources on Wayground

10 questions
Equation of a Line (2)
Quiz
•
6th Grade

15 questions
OpenUp 6th Math 3.10 Review
Quiz
•
6th Grade

15 questions
Graph and Write Inequalities
Quiz
•
6th Grade - University

14 questions
Box & Whisker Plots
Quiz
•
6th - 8th Grade

12 questions
Integers_Grade 6
Quiz
•
6th Grade

15 questions
Positive and Negative Integers
Quiz
•
6th - 8th Grade

15 questions
FAST Prep ( NSO and AR Benchmark
Quiz
•
6th Grade

10 questions
Transformation
Quiz
•
6th - 9th Grade
Popular Resources on Wayground

15 questions
Fractions on a Number Line
Quiz
•
3rd Grade

20 questions
Equivalent Fractions
Quiz
•
3rd Grade

25 questions
Multiplication Facts
Quiz
•
5th Grade

22 questions
fractions
Quiz
•
3rd Grade

20 questions
Main Idea and Details
Quiz
•
5th Grade

20 questions
Context Clues
Quiz
•
6th Grade

15 questions
Equivalent Fractions
Quiz
•
4th Grade

20 questions
Figurative Language Review
Quiz
•
6th Grade
Discover more resources for Mathematics

20 questions
Exponents
Quiz
•
6th Grade

15 questions
Distributive Property & Review
Quiz
•
6th Grade

20 questions
Writing Algebraic Expressions
Quiz
•
6th Grade

20 questions
Ratios/Rates and Unit Rates
Quiz
•
6th Grade

20 questions
Writing and Graphing Inequalities
Quiz
•
6th Grade

10 questions
Unit Rate
Quiz
•
6th Grade

20 questions
Graphing Inequalities on a Number Line
Quiz
•
6th - 9th Grade

18 questions
Combining Like Terms
Quiz
•
6th Grade

