Data
Authored by Emily Hall
Mathematics
5th - 6th Grade
CCSS covered
Used 15+ times

AI Actions
Add similar questions
Adjust reading levels
Convert to real-world scenario
Translate activity
More...
Content View
Student View
20 questions
Show all answers
1.
MULTIPLE CHOICE QUESTION
1 min • 1 pt

How many students have 12 Brothers and Sisters?
Tags
CCSS.6.SP.B.4
CCSS.HSS.ID.A.1
2.
MULTIPLE CHOICE QUESTION
1 min • 1 pt

What type of graph is this?
3.
MULTIPLE CHOICE QUESTION
2 mins • 1 pt

What is not a reasonable conclusion to be drawn from this graph?
There are about twice as many Sprint customers as there are T-Mobile
Verizon has increased their total number of customers since last year
AT&T has better service coverage than the other cell phone providers
T-Mobile is the least common provider for those who were surveyed
Tags
CCSS.6.SP.B.4
CCSS.6.SP.B.5
CCSS.6.SP.A.1
CCSS.6.SP.A.2
CCSS.6.SP.A.3
4.
MULTIPLE CHOICE QUESTION
1 min • 1 pt

Something important is missing from this chart. What is it?
an 'other' option
a title
a 'rabbit' option
tally marks
5.
MULTIPLE CHOICE QUESTION
1 min • 1 pt

If 40 children were surveyed for this graph, how many children chose hamsters as their favourite animal?
25
10
20
40
6.
MULTIPLE CHOICE QUESTION
1 min • 1 pt

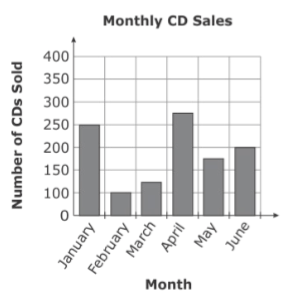
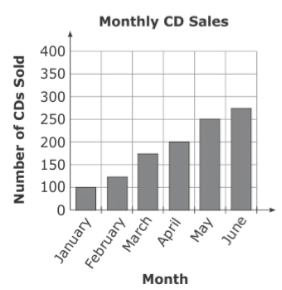
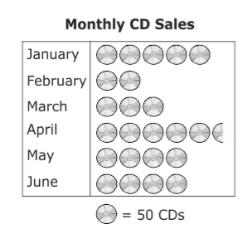
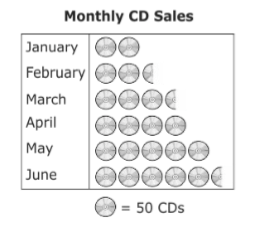
In the chart , a music store listed the number of CDs sold each month for 6 months. Which graph correctly represents the information in the chart?


Tags
CCSS.HSF.IF.B.4
7.
MULTIPLE CHOICE QUESTION
1 min • 1 pt

What type of graph is this?
Tags
CCSS.6.SP.B.4
Access all questions and much more by creating a free account
Create resources
Host any resource
Get auto-graded reports

Continue with Google

Continue with Email

Continue with Classlink

Continue with Clever
or continue with

Microsoft
%20(1).png)
Apple
Others
Already have an account?
Similar Resources on Wayground

20 questions
Converting imperial measurements to metric and vice versa
Quiz
•
6th Grade

15 questions
Assessment 1
Quiz
•
5th Grade

15 questions
الكسور
Quiz
•
6th Grade

20 questions
MMS Unit 5 Lessons 1, 2, 3, 4, , 5
Quiz
•
6th Grade

18 questions
5th Year Maths Test: The Circle
Quiz
•
5th - 6th Grade

15 questions
OpenUp 6th Math 3.10 Review
Quiz
•
6th Grade

19 questions
Math retake
Quiz
•
5th - 6th Grade

20 questions
Week 6: P5 - (Volume)
Quiz
•
5th Grade
Popular Resources on Wayground

15 questions
Fractions on a Number Line
Quiz
•
3rd Grade

20 questions
Equivalent Fractions
Quiz
•
3rd Grade

25 questions
Multiplication Facts
Quiz
•
5th Grade

22 questions
fractions
Quiz
•
3rd Grade

20 questions
Main Idea and Details
Quiz
•
5th Grade

20 questions
Context Clues
Quiz
•
6th Grade

15 questions
Equivalent Fractions
Quiz
•
4th Grade

20 questions
Figurative Language Review
Quiz
•
6th Grade
Discover more resources for Mathematics

25 questions
Multiplication Facts
Quiz
•
5th Grade

20 questions
Exponents
Quiz
•
6th Grade

10 questions
Multiplying Fractions
Quiz
•
5th Grade

15 questions
Distributive Property & Review
Quiz
•
6th Grade

20 questions
Writing Algebraic Expressions
Quiz
•
6th Grade

20 questions
Ratios/Rates and Unit Rates
Quiz
•
6th Grade

20 questions
Writing and Graphing Inequalities
Quiz
•
6th Grade

10 questions
Unit Rate
Quiz
•
6th Grade


