Interpreting Graphs/Increasing & Decreasing Graphs
Authored by Brookelyn Visker
Mathematics
9th - 12th Grade
CCSS covered
Used 7+ times

AI Actions
Add similar questions
Adjust reading levels
Convert to real-world scenario
Translate activity
More...
Content View
Student View
26 questions
Show all answers
1.
MULTIPLE SELECT QUESTION
30 sec • 1 pt
Why is it important to take Algebra?
Algebra helps you think logically
Modern technology uses Algebra
Algebra helps develop critical thinking skills
Gives real world applications
Tags
CCSS.8.EE.C.7B
2.
MULTIPLE CHOICE QUESTION
30 sec • 1 pt

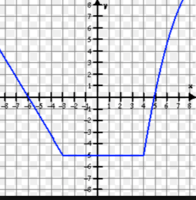
What is/are the increasing interval(s) for the function shown?
Tags
CCSS.HSF.IF.B.4
CCSS.HSF.IF.C.7
3.
MULTIPLE CHOICE QUESTION
30 sec • 1 pt

What is the BEST title for this graph?
The Relationship between Time Spent Studying and Test Grades
The effect of Time Spent Studying and Test Grades
Time Spent Studying
Test Grades
Tags
CCSS.8.EE.B.5
4.
MULTIPLE CHOICE QUESTION
5 mins • 1 pt

What label is along the y-axis in this graph?
Copyright 2007
Lines
Age in Years
Number of Teens
Tags
CCSS.8.EE.B.5
5.
MULTIPLE CHOICE QUESTION
5 mins • 1 pt

What is the general trend of this line graph?
The more you mow, the less money you make.
You make the same amount of money regardless of how long you mow.
The more you mow, the more money you make.
Mowing is dangerous.
Tags
CCSS.HSF.LE.B.5
6.
MULTIPLE CHOICE QUESTION
5 mins • 1 pt

How much does it cost to have your lawn mowed for 2 hours?
$16
$17
$18
$19
Tags
CCSS.8.EE.B.5
7.
MULTIPLE CHOICE QUESTION
5 mins • 1 pt

Which statement below accurately represents the graph?
$100 is earned for each hour worked
$100 is earned for every 2 hours worked
$500 is earned for every 8 hours worked
$200 is earned for every 3 hours worked
Tags
CCSS.8.EE.B.5


Access all questions and much more by creating a free account
Create resources
Host any resource
Get auto-graded reports
Continue with Google

Continue with Email
Continue with Classlink
Continue with Clever
or continue with
Microsoft
%20(1).png)
Apple
Others
Already have an account?
Similar Resources on Wayground

22 questions
mental maths-25 a
Quiz
•
9th - 12th Grade
22 questions
Przekształcanie wykresów funkcji. Funkcja liniowa
Quiz
•
9th - 11th Grade
21 questions
STAT. MID TERM. TERMS CHAPTERS 6-9
Quiz
•
12th Grade
21 questions
Review
Quiz
•
11th Grade
22 questions
Dan geodeta kviz- izbor i slagalica
Quiz
•
12th Grade
23 questions
Revisão - Trigonometria
Quiz
•
10th Grade
22 questions
Geometry Cycle 5 Review
Quiz
•
10th Grade
22 questions
Convering between metric units g7
Quiz
•
7th Grade - University
Popular Resources on Wayground
15 questions
Fractions on a Number Line
Quiz
•
3rd Grade
20 questions
Equivalent Fractions
Quiz
•
3rd Grade
25 questions
Multiplication Facts
Quiz
•
5th Grade
22 questions
fractions
Quiz
•
3rd Grade
20 questions
Main Idea and Details
Quiz
•
5th Grade
20 questions
Context Clues
Quiz
•
6th Grade
15 questions
Equivalent Fractions
Quiz
•
4th Grade
20 questions
Figurative Language Review
Quiz
•
6th Grade
Discover more resources for Mathematics
20 questions
Graphing Inequalities on a Number Line
Quiz
•
6th - 9th Grade
12 questions
Exponential Growth and Decay
Quiz
•
9th Grade
20 questions
Exponent Rules Review
Quiz
•
8th - 9th Grade
25 questions
Complementary and Supplementary Angles
Quiz
•
7th - 10th Grade
12 questions
Add and Subtract Polynomials
Quiz
•
9th - 12th Grade
13 questions
Model Exponential Growth and Decay Scenarios
Quiz
•
9th - 12th Grade
15 questions
Combine Like Terms and Distributive Property
Quiz
•
8th - 9th Grade
27 questions
7.2.3 Quadrilateral Properties
Quiz
•
9th - 12th Grade