Dot Plot, Histogram, Box Plot Quiz
Authored by Daniel Maurer
Mathematics
9th Grade
CCSS covered
Used 62+ times

AI Actions
Add similar questions
Adjust reading levels
Convert to real-world scenario
Translate activity
More...
Content View
Student View
8 questions
Show all answers
1.
MULTIPLE CHOICE QUESTION
15 mins • 1 pt

Determine what the Quartile 1 is given the box plot.
4
5
7
10
Tags
CCSS.6.SP.B.4
CCSS.HSS.ID.A.1
2.
MULTIPLE CHOICE QUESTION
15 mins • 1 pt
Determine what the Median is given the box plot.
4
5
7
10
Tags
CCSS.6.SP.B.4
CCSS.HSS.ID.A.1
3.
MULTIPLE CHOICE QUESTION
15 mins • 1 pt
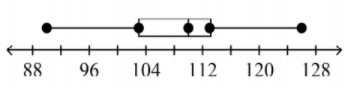
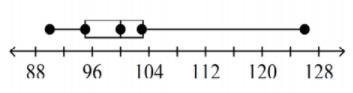
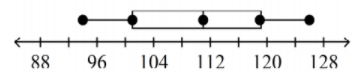
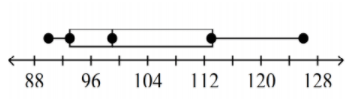
Which box plot represents the data below?
90, 91, 93, 93, 95, 96, 98, 99, 101, 110, 112, 113, 123, 125, 126
Tags
CCSS.6.SP.B.4
CCSS.HSS.ID.A.1
4.
MULTIPLE CHOICE QUESTION
15 mins • 1 pt

The dot plot below represents which data set?
2, 3, 4, 4, 6, 7, 8, 8, 9, 9, 9, 10, 10, 11, 12
2, 3, 4, 6, 7, 8, 9, 10, 11, 12
2, 3, 4, 4, 6, 7, 8, 8, 8, 9, 9, 10, 11, 12
2, 3, 4, 4, 6, 7, 8, 8, 8, 9, 9, 9, 10, 11, 12
Tags
CCSS.6.SP.B.4
CCSS.HSS.ID.A.1
5.
MULTIPLE CHOICE QUESTION
15 mins • 1 pt

The histogram represents which data set?
85, 90, 100, 105, 110, 120, 125, 130
85, 85, 85, 85, 90, 90, 100, 100, 105, 110, 120, 125, 130, 130
85, 85, 85, 90, 90, 90, 100, 100, 105, 110, 120, 125, 130, 130
85, 85, 85, 90, 90, 100, 100, 105, 125, 130, 130
Tags
CCSS.6.SP.B.4
CCSS.HSS.ID.A.1
6.
MULTIPLE CHOICE QUESTION
15 mins • 1 pt

How many people have four books in their desks?
Tags
CCSS.2.MD.D.9
CCSS.3.MD.B.4
7.
MULTIPLE CHOICE QUESTION
15 mins • 1 pt

Which restaurant has a higher median wait time?
Tags
CCSS.6.SP.B.4
CCSS.HSS.ID.A.1

Access all questions and much more by creating a free account
Create resources
Host any resource
Get auto-graded reports
Continue with Google

Continue with Email
Continue with Classlink
Continue with Clever
or continue with
Microsoft
%20(1).png)
Apple
Others
Already have an account?
Similar Resources on Wayground

12 questions
Multiplication table جدول ضرب 10
Quiz
•
1st - 10th Grade
13 questions
Znaky dělitelnosti 2
Quiz
•
6th - 9th Grade
10 questions
UNSA notables
Quiz
•
6th - 12th Grade
13 questions
Productos Notables - Factorización
Quiz
•
8th - 10th Grade
12 questions
Logaritmo
Quiz
•
8th - 10th Grade
7 questions
Transformar
Quiz
•
1st - 10th Grade
10 questions
Cuestionario Lógica
Quiz
•
4th - 11th Grade
10 questions
Площадь трапеции
Quiz
•
9th Grade
Popular Resources on Wayground
15 questions
Fractions on a Number Line
Quiz
•
3rd Grade
20 questions
Equivalent Fractions
Quiz
•
3rd Grade
25 questions
Multiplication Facts
Quiz
•
5th Grade
22 questions
fractions
Quiz
•
3rd Grade
20 questions
Main Idea and Details
Quiz
•
5th Grade
20 questions
Context Clues
Quiz
•
6th Grade
15 questions
Equivalent Fractions
Quiz
•
4th Grade
20 questions
Figurative Language Review
Quiz
•
6th Grade
Discover more resources for Mathematics
20 questions
Graphing Inequalities on a Number Line
Quiz
•
6th - 9th Grade
12 questions
Exponential Growth and Decay
Quiz
•
9th Grade
20 questions
Exponent Rules Review
Quiz
•
8th - 9th Grade
25 questions
Complementary and Supplementary Angles
Quiz
•
7th - 10th Grade
12 questions
Add and Subtract Polynomials
Quiz
•
9th - 12th Grade
13 questions
Model Exponential Growth and Decay Scenarios
Quiz
•
9th - 12th Grade
15 questions
Combine Like Terms and Distributive Property
Quiz
•
8th - 9th Grade
27 questions
7.2.3 Quadrilateral Properties
Quiz
•
9th - 12th Grade