
Graphs Review- Stem and Leaf, Line Plots, and Histograms
Authored by Maria Vaughn
Mathematics
6th - 8th Grade
Used 3+ times


AI Actions
Add similar questions
Adjust reading levels
Convert to real-world scenario
Translate activity
More...
Content View
Student View
25 questions
Show all answers
1.
MULTIPLE CHOICE QUESTION
1 min • 1 pt

How many scores are listed in this Stem and Leaf Plot?
2.
MULTIPLE CHOICE QUESTION
1 min • 1 pt
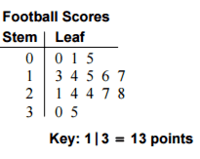
In how many games did the team score more than 20 points?
3.
MULTIPLE CHOICE QUESTION
1 min • 1 pt

What is the highest quiz grade in the stem and leaf plot?
4.
MULTIPLE CHOICE QUESTION
2 mins • 1 pt

How many cities have temperatures between 70 degrees and 99 degrees?
44
34
26
62
5.
MULTIPLE CHOICE QUESTION
3 mins • 1 pt

A florist recorded the number and cost of flower bouquets that were sold daily and recorded the data below. What is the frequency of a bouquet that cost at least $40?
6.
MULTIPLE CHOICE QUESTION
2 mins • 1 pt

Which interval shows the greatest number of pets?
7.
MULTIPLE CHOICE QUESTION
2 mins • 1 pt

Elliot says almost everyone arrived at the party after 10:00 P.M., but Nancy thinks most people came earlier. When did a majority of the people arrive?

Access all questions and much more by creating a free account
Create resources
Host any resource
Get auto-graded reports

Continue with Google

Continue with Email

Continue with Classlink

Continue with Clever
or continue with

Microsoft
%20(1).png)
Apple

Others
Already have an account?

