Creating stem and leaf diagrams - Grade 8 practice
Authored by Geoffrey Lufanana
Mathematics
8th - 9th Grade
Used 45+ times

AI Actions
Add similar questions
Adjust reading levels
Convert to real-world scenario
Translate activity
More...
Content View
Student View
20 questions
Show all answers
1.
MULTIPLE CHOICE QUESTION
30 sec • 1 pt
List, from least to greatest, the stems of a stem-and-leaf plot representing the following data set:
2, 29, 65, 31, and 93.
Hint; in this question, imagine you are drawing a stem and leaf diagram form the data, what would the numbers in the stem be in ascending order.
1, 2, 3, 5, 9
0, 2, 3, 6, 9
0, 1, 2, 3, 9
0, 2, 3, 6, 8
1, 2, 3, 6, 9
2.
FILL IN THE BLANKS QUESTION
1 min • 1 pt

Write the number only.
(a)
3.
MULTIPLE CHOICE QUESTION
30 sec • 1 pt

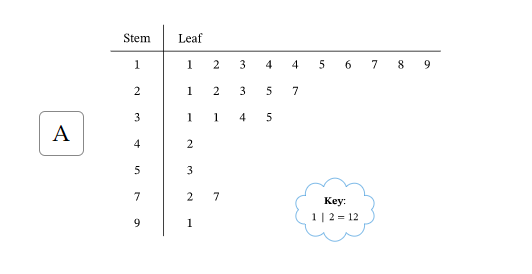
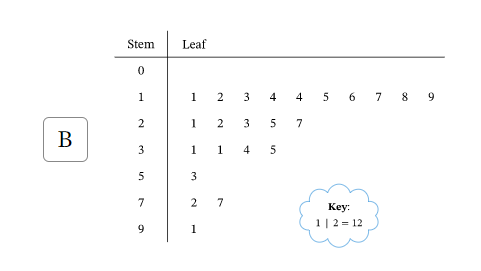
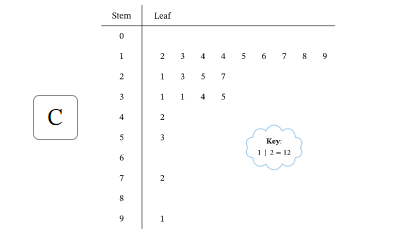
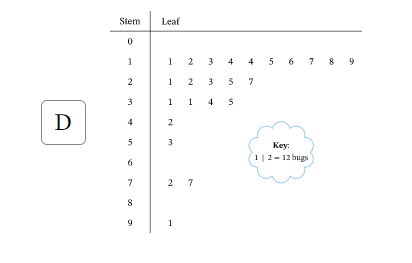
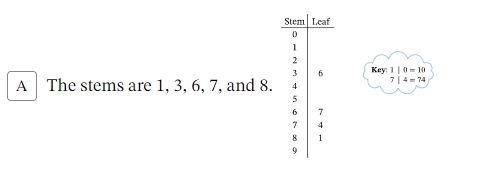
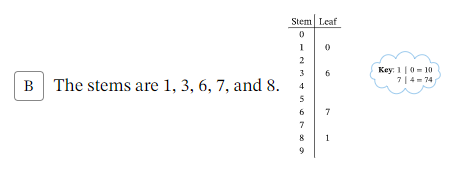
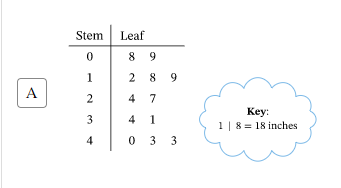
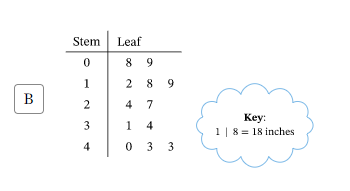
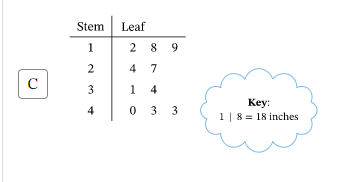
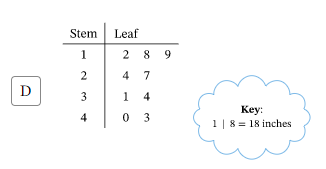
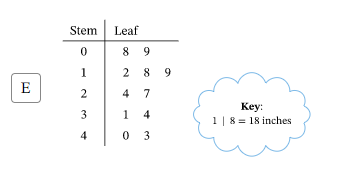
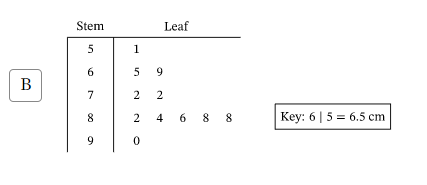
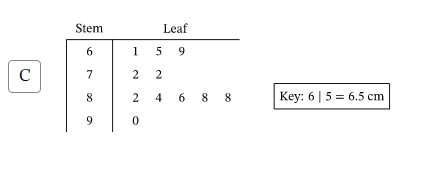
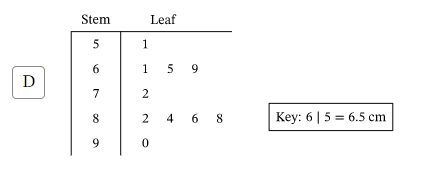
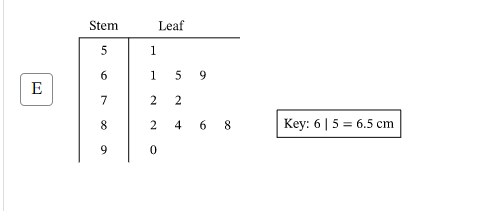
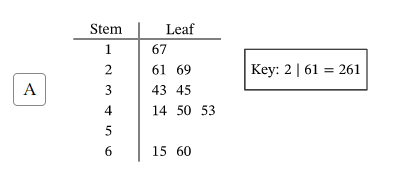
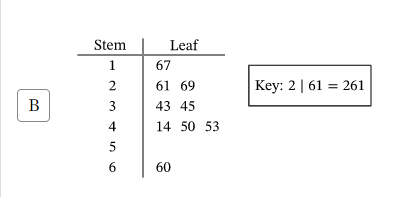
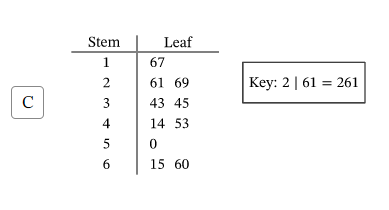
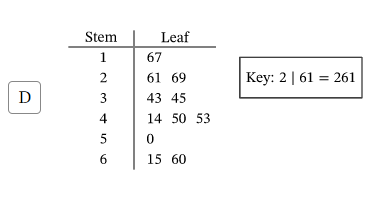
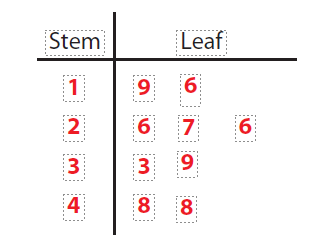
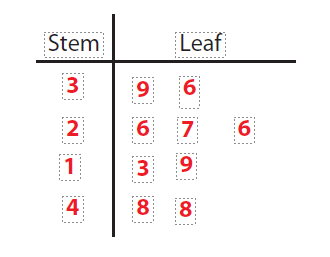
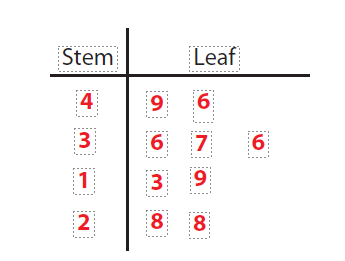
Which options show the stem and leaf diagram for the data shown?
4.
MULTIPLE CHOICE QUESTION
30 sec • 1 pt
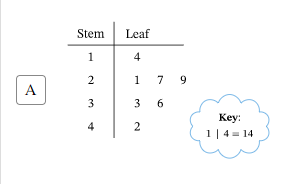
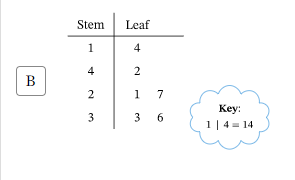
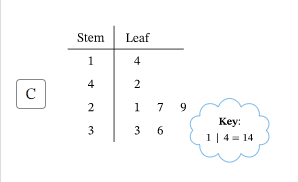
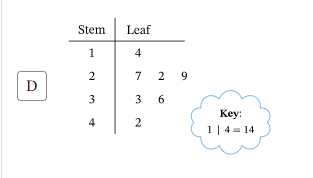
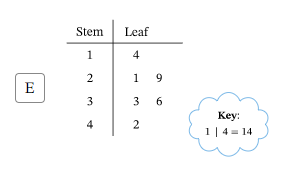
Which of the following stem and leaf diagrams represent the data below;
14,42,21,33,36,27,29.
5.
MULTIPLE CHOICE QUESTION
30 sec • 1 pt
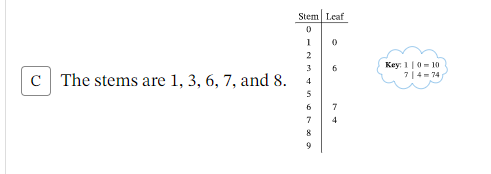
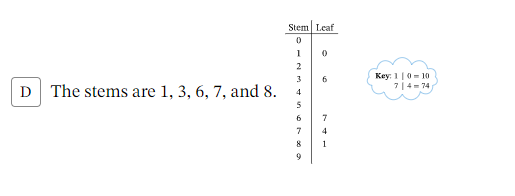
Which stem and leaf diagram represents the data below;
67, 81, 74, 10, and 36.
6.
MULTIPLE CHOICE QUESTION
30 sec • 1 pt

7.
MULTIPLE CHOICE QUESTION
30 sec • 1 pt

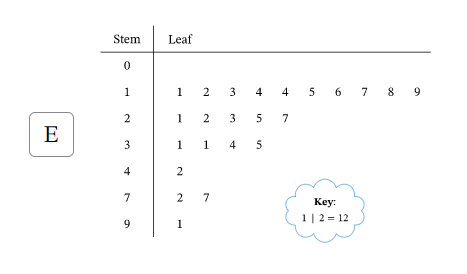
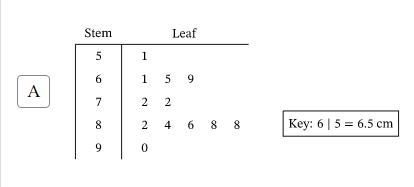
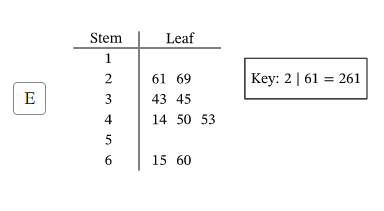
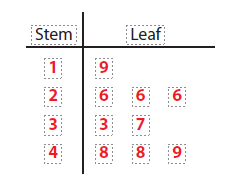
Consider the stem and leaf diagram shown, what are the maximum and minimum values?
Maximum value - 93, Minimum value - 32
Maximum value - 39, Minimum value - 23
Maximum value - 77, Minimum value - 35
Maximum value - 43, Minimum value - 32

Access all questions and much more by creating a free account
Create resources
Host any resource
Get auto-graded reports
Continue with Google

Continue with Email
Continue with Classlink
Continue with Clever
or continue with
Microsoft
%20(1).png)
Apple
Others
Already have an account?
