Ratio Tables and Graphs
Authored by Kate Lopez
Mathematics
6th Grade
CCSS covered
Used 542+ times

AI Actions
Add similar questions
Adjust reading levels
Convert to real-world scenario
Translate activity
More...
Content View
Student View
10 questions
Show all answers
1.
MULTIPLE CHOICE QUESTION
5 mins • 1 pt

What is the missing number in the ratio table?
Tags
CCSS.6.RP.A.1
CCSS.6.RP.A.3
2.
MULTIPLE CHOICE QUESTION
5 mins • 1 pt

Which statement matches the graph?
Tags
CCSS.7.RP.A.2D
3.
MULTIPLE CHOICE QUESTION
30 sec • 1 pt
What is the ratio of the line graph shown?
4:1
2:1
3:2
8:1
Tags
CCSS.7.RP.A.2C
4.
MULTIPLE CHOICE QUESTION
30 sec • 1 pt

Which of the following statements can be used to create the graph shown?
For every 5 hours of work you get $6
For every 24 hours of work you get $10
For every 36 hours of work you get $50
For every 6 hours of work you get $5
Tags
CCSS.7.RP.A.2D
5.
MULTIPLE CHOICE QUESTION
30 sec • 1 pt
Which of the following tables use a 1:2 ratio?


Tags
CCSS.6.RP.A.1
CCSS.6.RP.A.3
6.
MULTIPLE CHOICE QUESTION
30 sec • 1 pt
A store is having a sale on DVDs. The sale price of 3 DVDs is $12.00. Which table shows this relationship?


Tags
CCSS.6.RP.A.3B
7.
MULTIPLE CHOICE QUESTION
30 sec • 1 pt

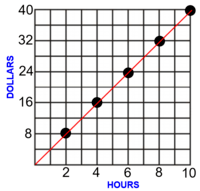
The graph shows the cost of buying paint in 1-gallon buckets. Based on the graph, which dollar amount represents the cost to buy five 1-gallon buckets of paint?
$120
$125
$130
$135
Tags
CCSS.7.RP.A.2D


Access all questions and much more by creating a free account
Create resources
Host any resource
Get auto-graded reports
Continue with Google

Continue with Email
Continue with Classlink
Continue with Clever
or continue with
Microsoft
%20(1).png)
Apple
Others
Already have an account?
Similar Resources on Wayground

15 questions
G6_Mental Math Competition_Round 2
Quiz
•
6th Grade
10 questions
kite
Quiz
•
6th - 8th Grade
10 questions
Long Division Quiz
Quiz
•
6th Grade
12 questions
CGP L6 Word Test 21
Quiz
•
6th Grade
15 questions
Reviewer_ Ratio and Proportion
Quiz
•
6th Grade
14 questions
volume of a cone
Quiz
•
5th - 6th Grade
10 questions
OpenUp 6th Math 7.14 Practice Problems and Vocab
Quiz
•
6th Grade
10 questions
Rounding KS2
Quiz
•
6th Grade
Popular Resources on Wayground
15 questions
Fractions on a Number Line
Quiz
•
3rd Grade
10 questions
Probability Practice
Quiz
•
4th Grade
15 questions
Probability on Number LIne
Quiz
•
4th Grade
20 questions
Equivalent Fractions
Quiz
•
3rd Grade
25 questions
Multiplication Facts
Quiz
•
5th Grade
22 questions
fractions
Quiz
•
3rd Grade
6 questions
Appropriate Chromebook Usage
Lesson
•
7th Grade
10 questions
Greek Bases tele and phon
Quiz
•
6th - 8th Grade
Discover more resources for Mathematics
20 questions
Writing Algebraic Expressions
Quiz
•
6th Grade
20 questions
Ratios/Rates and Unit Rates
Quiz
•
6th Grade
20 questions
Graphing Inequalities on a Number Line
Quiz
•
6th - 9th Grade
20 questions
One Step Equations
Quiz
•
6th Grade
12 questions
One-Step Equations
Quiz
•
6th Grade
6 questions
Equations from models
Quiz
•
6th Grade
15 questions
Equivalent Ratios
Quiz
•
6th Grade
20 questions
Writing Ratios & Identifying Equivalent Ratios
Quiz
•
6th Grade