10-28-25 Graphing Rational Functions
Authored by D Santiago
Mathematics
9th - 12th Grade
CCSS covered
Used 9+ times

AI Actions
Add similar questions
Adjust reading levels
Convert to real-world scenario
Translate activity
More...
Content View
Student View
15 questions
Show all answers
1.
MULTIPLE CHOICE QUESTION
5 mins • 1 pt

What is the domain and range?
R: All real number y≠ 1
R: All real number y≠ -3
R: All real number y≠ 1
R: All real number y≠ 3
Tags
CCSS.8.F.A.1
CCSS.HSF.IF.B.5
2.
MULTIPLE CHOICE QUESTION
2 mins • 1 pt

What is the vertical asymptote?
Tags
CCSS.HSF-IF.C.7D
3.
MULTIPLE CHOICE QUESTION
2 mins • 1 pt
Which asymptote(s) are determined by looking at the denominator?
Tags
CCSS.HSF-IF.C.7D
4.
MULTIPLE CHOICE QUESTION
3 mins • 1 pt

What are the asymptotes?
Tags
CCSS.HSF-IF.C.7D
5.
MULTIPLE CHOICE QUESTION
5 mins • 1 pt

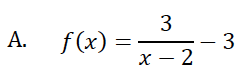
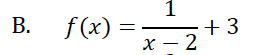
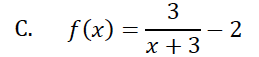
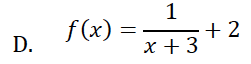
Which of the following represents the graph below?
Tags
CCSS.HSF-IF.C.7D
6.
MULTIPLE CHOICE QUESTION
5 mins • 1 pt

What is the horizontal asymptote?
Tags
CCSS.HSF-IF.C.7D
7.
MULTIPLE CHOICE QUESTION
2 mins • 1 pt
What is an asymptote?
an imaginary line that your function never touches
a part of your function
a point on your graph
a type of fruit
Tags
CCSS.HSF-IF.C.7D


Access all questions and much more by creating a free account
Create resources
Host any resource
Get auto-graded reports
Continue with Google

Continue with Email
Continue with Classlink
Continue with Clever
or continue with
Microsoft
%20(1).png)
Apple
Others
Already have an account?
Similar Resources on Wayground

20 questions
Thử thách Toán Tuần 11
Quiz
•
5th Grade - University
10 questions
Trigonometri Tingkatan 3
Quiz
•
8th - 10th Grade
10 questions
Asesmen Awal
Quiz
•
11th Grade
13 questions
ULANGAN HARIAN SEMESTER 1 MATEMATIKA PEMINATAN X MIPA
Quiz
•
12th Grade
10 questions
Limit Tak hingga 1
Quiz
•
12th Grade - University
15 questions
Year 10 Solving Equations
Quiz
•
9th - 11th Grade
10 questions
Congruencia de Triangulos
Quiz
•
7th - 9th Grade
20 questions
Me divierto con las Matemáticas LILEGRE 8° y 9° 2020.
Quiz
•
1st Grade - University
Popular Resources on Wayground
15 questions
Fractions on a Number Line
Quiz
•
3rd Grade
20 questions
Equivalent Fractions
Quiz
•
3rd Grade
25 questions
Multiplication Facts
Quiz
•
5th Grade
54 questions
Analyzing Line Graphs & Tables
Quiz
•
4th Grade
22 questions
fractions
Quiz
•
3rd Grade
20 questions
Main Idea and Details
Quiz
•
5th Grade
20 questions
Context Clues
Quiz
•
6th Grade
15 questions
Equivalent Fractions
Quiz
•
4th Grade
Discover more resources for Mathematics
20 questions
Graphing Inequalities on a Number Line
Quiz
•
6th - 9th Grade
18 questions
SAT Prep: Ratios, Proportions, & Percents
Quiz
•
9th - 10th Grade
12 questions
Exponential Growth and Decay
Quiz
•
9th Grade
12 questions
Parallel Lines Cut by a Transversal
Quiz
•
10th Grade
12 questions
Add and Subtract Polynomials
Quiz
•
9th - 12th Grade
15 questions
Combine Like Terms and Distributive Property
Quiz
•
8th - 9th Grade
20 questions
Function or Not a Function
Quiz
•
8th - 9th Grade
10 questions
Elijah McCoy: Innovations and Impact in Black History
Interactive video
•
6th - 10th Grade