
Statistics Test Study Guide
6th Grade
•25 Qs

Similar activities
PENILAIAN TENGAH SEMESTER 2 MATEMATIKA KD 3.8
6th Grade
•20 Qs
LATIHAN 1, MATEMATIK TINGKATAN 4, CIKGU AZLINA SMK TOK SERA
1st Grade - University
•20 Qs
durga
6th - 10th Grade
•20 Qs
Q1 - Ratio and Proportion
5th - 6th Grade
•20 Qs
Integers and Fractions
6th - 8th Grade
•20 Qs
MATHQUIZ#3- FRACTIONS
6th Grade
•20 Qs
add maths (c4)
1st - 12th Grade
•20 Qs
Quiz Matematika Kelas 5 Semester 2
1st - 12th Grade
•20 Qs

Statistics Test Study Guide
Quiz
•
Mathematics
•
6th Grade
•
Easy
+3
Standards-aligned

Kellany Bennett
Used 3+ times
FREE Resource
Enhance your content in a minute
25 questions
Show all answers
1.
MULTIPLE SELECT QUESTION
45 sec • 4 pts

Every part of the box plot represents what part of the data values?
There are 2 correct answers.
25%
1/4
50%
1/2
Tags
CCSS.6.SP.B.4
CCSS.HSS.ID.A.1
2.
MULTIPLE CHOICE QUESTION
30 sec • 4 pts
Since every part of the box plot represents exactly 25% or 1/4 of the data values, what does the size or length of each part tell you?
How much variety or spread there is in that 25% group
How much data is in that group--a bigger part means more data
Tags
CCSS.6.SP.B.4
CCSS.HSS.ID.A.1
3.
MULTIPLE CHOICE QUESTION
2 mins • 4 pts

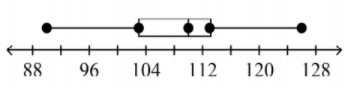
What is the median of the data?
10
12
13
14
18
Tags
CCSS.6.SP.B.4
CCSS.HSS.ID.A.1
4.
MULTIPLE CHOICE QUESTION
15 mins • 4 pts
For the data set shown, what is the median?
{10, 12, 14, 14, 16, 18, 20, 20}
14
15
15.5
16
Tags
CCSS.6.SP.B.5C
5.
MULTIPLE CHOICE QUESTION
30 sec • 4 pts

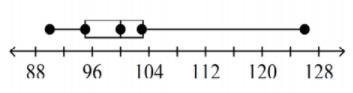
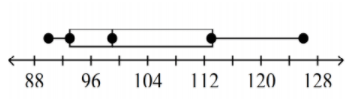
Which has a higher median?
Florida
Texas
Tags
CCSS.HSS.ID.A.3
6.
MULTIPLE CHOICE QUESTION
3 mins • 4 pts

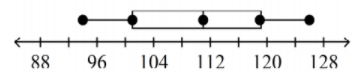
What is the interquartile range?
Tags
CCSS.6.SP.B.4
CCSS.HSS.ID.A.1
7.
MULTIPLE CHOICE QUESTION
3 mins • 4 pts
Which of the following best describes the process of finding the interquartile range for a set of data?
Tags
CCSS.6.SP.B.5C


Access all questions and much more by creating a free account
Create resources
Host any resource
Get auto-graded reports
Continue with Google

Continue with Email
Continue with Classlink
Continue with Clever
or continue with
Microsoft
%20(1).png)
Apple
Others
Already have an account?
Similar Resources on Wayground
20 questions
27 Week LCA STUDY GUIDE 6th Grade Math Connections
Quiz
•
6th Grade
20 questions
Lomba Matematika Kelas 6
Quiz
•
6th Grade
20 questions
MATEMATIK TAHUN 6 (PERWAKILAN DATA)
Quiz
•
1st - 6th Grade
20 questions
Matematik Pengguna
Quiz
•
3rd - 8th Grade
20 questions
ROUNDING DECIMALS
Quiz
•
5th - 6th Grade
22 questions
Graphical Displays
Quiz
•
6th - 7th Grade
20 questions
Areas of Plane Figures
Quiz
•
6th - 9th Grade
20 questions
CRM 1.2 Review
Quiz
•
6th Grade
Popular Resources on Wayground
15 questions
Fractions on a Number Line
Quiz
•
3rd Grade
20 questions
Equivalent Fractions
Quiz
•
3rd Grade
25 questions
Multiplication Facts
Quiz
•
5th Grade
22 questions
fractions
Quiz
•
3rd Grade
20 questions
Main Idea and Details
Quiz
•
5th Grade
20 questions
Context Clues
Quiz
•
6th Grade
15 questions
Equivalent Fractions
Quiz
•
4th Grade
20 questions
Figurative Language Review
Quiz
•
6th Grade
Discover more resources for Mathematics
20 questions
Exponents
Quiz
•
6th Grade
15 questions
Distributive Property & Review
Quiz
•
6th Grade
20 questions
Writing Algebraic Expressions
Quiz
•
6th Grade
20 questions
Ratios/Rates and Unit Rates
Quiz
•
6th Grade
20 questions
Writing and Graphing Inequalities
Quiz
•
6th Grade
10 questions
Unit Rate
Quiz
•
6th Grade
20 questions
Graphing Inequalities on a Number Line
Quiz
•
6th - 9th Grade
18 questions
Combining Like Terms
Quiz
•
6th Grade