Dot Plot, Histograms, Box Plot and 2 way tables
Authored by Maria Smith
Mathematics
9th Grade
CCSS covered
Used 7+ times

AI Actions
Add similar questions
Adjust reading levels
Convert to real-world scenario
Translate activity
More...
Content View
Student View
15 questions
Show all answers
1.
MULTIPLE CHOICE QUESTION
15 mins • 1 pt

Which interval shows the greatest number of pets?
15-19
0-4
5-9
10-14
Tags
CCSS.6.SP.B.4
CCSS.HSS.ID.A.1
2.
MULTIPLE CHOICE QUESTION
15 mins • 1 pt

What is the range of the data shown?
85
90
80
70
Tags
CCSS.6.SP.B.4
CCSS.HSS.ID.A.1
3.
MULTIPLE CHOICE QUESTION
15 mins • 1 pt

How many people have four books in their desks?
Tags
CCSS.3.MD.B.4
CCSS.2.MD.D.9
4.
MULTIPLE CHOICE QUESTION
15 mins • 1 pt

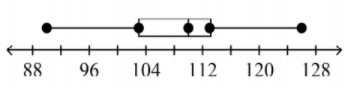
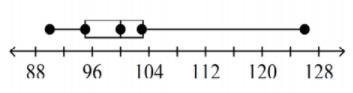
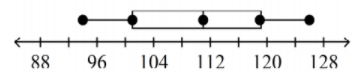
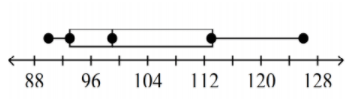
Which box and whisker plot has the highest median?
First plot
Second plot
Tags
CCSS.6.SP.B.4
CCSS.HSS.ID.A.1
5.
MULTIPLE CHOICE QUESTION
15 mins • 1 pt

What value is the lower quartile (Q1)?
66
58
60
64
Tags
CCSS.6.SP.B.4
CCSS.HSS.ID.A.1
6.
MULTIPLE CHOICE QUESTION
15 mins • 1 pt

What data value is the upper quartile (Q3)?
64
62
66
58
Tags
CCSS.6.SP.B.4
CCSS.HSS.ID.A.1
7.
MULTIPLE CHOICE QUESTION
15 mins • 1 pt

What is the interquartile range?
4
64
60
8
Tags
CCSS.6.SP.B.4
CCSS.HSS.ID.A.1


Access all questions and much more by creating a free account
Create resources
Host any resource
Get auto-graded reports
Continue with Google

Continue with Email
Continue with Classlink
Continue with Clever
or continue with
Microsoft
%20(1).png)
Apple
Others
Already have an account?
Similar Resources on Wayground

15 questions
Ulangkaji Nombor Perdana
Quiz
•
1st - 12th Grade
10 questions
五年级小数除法
Quiz
•
1st - 10th Grade
20 questions
Mineduc D
Quiz
•
7th - 12th Grade
20 questions
Математикалық сауаттылық
Quiz
•
1st Grade - Professio...
18 questions
Ratio, distance, speed and time
Quiz
•
8th - 9th Grade
10 questions
Lesson 5:Tangent and Secant Segments-Quarter 2-Short Quiz
Quiz
•
9th - 10th Grade
20 questions
CfE Level 2/3 Percentages
Quiz
•
8th - 9th Grade
10 questions
แบบทดสอบการคำนวณพื้นที่ในงานช่าง
Quiz
•
7th Grade - University
Popular Resources on Wayground
15 questions
Fractions on a Number Line
Quiz
•
3rd Grade
20 questions
Equivalent Fractions
Quiz
•
3rd Grade
25 questions
Multiplication Facts
Quiz
•
5th Grade
54 questions
Analyzing Line Graphs & Tables
Quiz
•
4th Grade
22 questions
fractions
Quiz
•
3rd Grade
20 questions
Main Idea and Details
Quiz
•
5th Grade
20 questions
Context Clues
Quiz
•
6th Grade
15 questions
Equivalent Fractions
Quiz
•
4th Grade
Discover more resources for Mathematics
20 questions
Graphing Inequalities on a Number Line
Quiz
•
6th - 9th Grade
18 questions
SAT Prep: Ratios, Proportions, & Percents
Quiz
•
9th - 10th Grade
12 questions
Exponential Growth and Decay
Quiz
•
9th Grade
12 questions
Add and Subtract Polynomials
Quiz
•
9th - 12th Grade
15 questions
Combine Like Terms and Distributive Property
Quiz
•
8th - 9th Grade
20 questions
Function or Not a Function
Quiz
•
8th - 9th Grade
10 questions
Elijah McCoy: Innovations and Impact in Black History
Interactive video
•
6th - 10th Grade
16 questions
Converting Improper Fractions to Mixed Numbers
Quiz
•
4th - 10th Grade