8 CBA 3 Review
Authored by David Strauss
Mathematics
8th Grade
CCSS covered
Used 12+ times

AI Actions
Add similar questions
Adjust reading levels
Convert to real-world scenario
Translate activity
More...
Content View
Student View
12 questions
Show all answers
1.
MULTIPLE CHOICE QUESTION
3 mins • 1 pt

Which statement below accurately represents the graph?
is the unit rate
Tags
CCSS.7.RP.A.2D
2.
MULTIPLE CHOICE QUESTION
3 mins • 1 pt
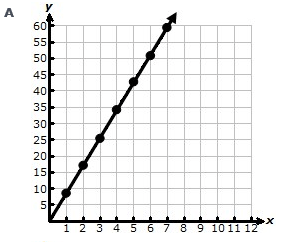
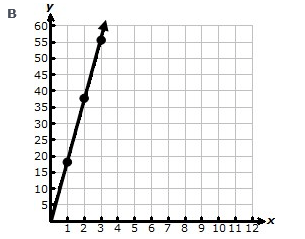
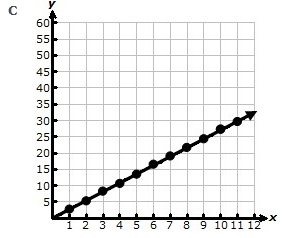
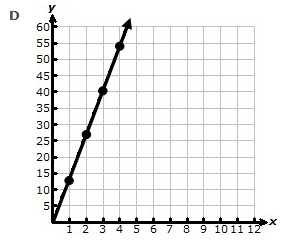
Carter receives $13.50 for every 5 boxes of chocolate he sells. Which graph shows this relationship?
Tags
CCSS.7.RP.A.2D
3.
MULTIPLE CHOICE QUESTION
3 mins • 1 pt

Which graph models this relationship?


Tags
CCSS.8.EE.B.5
4.
MULTIPLE CHOICE QUESTION
3 mins • 1 pt

Which statement is the correct unit rate?
5 seconds per foot
5 feet per second
2.5 seconds per foot
2.5 feet per second
Tags
CCSS.7.RP.A.2D
5.
MULTIPLE CHOICE QUESTION
3 mins • 1 pt

Which graph represents the data and shows the unit rate?


Tags
CCSS.8.EE.B.5
6.
MULTIPLE CHOICE QUESTION
3 mins • 1 pt

Find the slope.
Tags
CCSS.8.EE.B.5
7.
MULTIPLE CHOICE QUESTION
3 mins • 1 pt

Find the slope.
Tags
CCSS.8.EE.B.5


Access all questions and much more by creating a free account
Create resources
Host any resource
Get auto-graded reports
Continue with Google

Continue with Email
Continue with Classlink
Continue with Clever
or continue with
Microsoft
%20(1).png)
Apple
Others
Already have an account?
Similar Resources on Wayground

10 questions
UNSA notables
Quiz
•
6th - 12th Grade
10 questions
Hulkliikmete summa ja vahe
Quiz
•
8th - 9th Grade
10 questions
Simplification d'expressions
Quiz
•
8th Grade
13 questions
Productos Notables - Factorización
Quiz
•
8th - 10th Grade
15 questions
REVISÃO A1
Quiz
•
8th Grade
15 questions
Grade 8 - Geometry Terms
Quiz
•
7th - 8th Grade
12 questions
Multiplication table جدول ضرب 10
Quiz
•
1st - 10th Grade
13 questions
Znaky dělitelnosti 2
Quiz
•
6th - 9th Grade
Popular Resources on Wayground
15 questions
Fractions on a Number Line
Quiz
•
3rd Grade
20 questions
Equivalent Fractions
Quiz
•
3rd Grade
25 questions
Multiplication Facts
Quiz
•
5th Grade
29 questions
Alg. 1 Section 5.1 Coordinate Plane
Quiz
•
9th Grade
22 questions
fractions
Quiz
•
3rd Grade
11 questions
FOREST Effective communication
Lesson
•
KG
20 questions
Main Idea and Details
Quiz
•
5th Grade
20 questions
Context Clues
Quiz
•
6th Grade
Discover more resources for Mathematics
14 questions
finding slope from a graph
Quiz
•
8th Grade
20 questions
Graphing Inequalities on a Number Line
Quiz
•
6th - 9th Grade
8 questions
8th U6L1: Organizing Data
Quiz
•
8th Grade
20 questions
Slope from a Graph
Quiz
•
8th Grade
12 questions
8th U5 Test Review: Functions & Volume
Quiz
•
8th Grade
20 questions
Slope Intercept Form
Quiz
•
7th - 8th Grade
20 questions
Angle Relationships
Quiz
•
6th - 8th Grade
14 questions
Estimate and Classify Real Numbers
Quiz
•
8th Grade