Identifying and Reading Graphs
Authored by Daniel Cole
Mathematics
6th Grade
CCSS covered
Used 25+ times

AI Actions
Add similar questions
Adjust reading levels
Convert to real-world scenario
Translate activity
More...
Content View
Student View
20 questions
Show all answers
1.
MULTIPLE CHOICE QUESTION
30 sec • 1 pt

What type of graph is this?
line plot
line graph
bar graph
frequency table
2.
MULTIPLE CHOICE QUESTION
1 min • 3 pts

How many total people took the survey?
50
150
100
200
Tags
CCSS.3.MD.B.3
3.
MULTIPLE SELECT QUESTION
1 min • 2 pts

When is a good time to use a dot plot? (2 answers)
To help you find the smallest and largest values.
When you need to make a graph in the fastest way possible.
When you don't have a ruler to draw a column graph.
When you compare frequency distributions.
Tags
CCSS.6.SP.B.4
CCSS.HSS.ID.A.1
4.
MULTIPLE CHOICE QUESTION
30 sec • 3 pts

How many people have four books in their desks?
2
3
4
5
Tags
CCSS.3.MD.B.4
5.
MULTIPLE CHOICE QUESTION
30 sec • 3 pts

How many more people have purple for a favorite color than red?
Tags
CCSS.3.OA.D.8
6.
MULTIPLE CHOICE QUESTION
30 sec • 1 pt

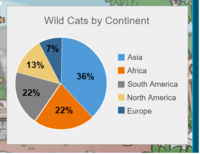
What type of graph is shown?
pictograph
stem and leaf
pie chart
histogram
7.
MULTIPLE CHOICE QUESTION
30 sec • 1 pt

What fraction of the graph is red?
1
---
2
1
---
4
3
---
4
90 degrees
Tags
CCSS.3.G.A.2
Access all questions and much more by creating a free account
Create resources
Host any resource
Get auto-graded reports

Continue with Google

Continue with Email

Continue with Classlink

Continue with Clever
or continue with

Microsoft
%20(1).png)
Apple
Others
Already have an account?
Similar Resources on Wayground

18 questions
Percent Proportion
Quiz
•
6th Grade

16 questions
FS MATHS LEVEL 1 EXAM Revision SAM Set 2 - Part 1
Quiz
•
6th Grade

25 questions
Convert measurement units
Quiz
•
4th - 6th Grade

20 questions
1.0 INDEKS Tingkatan 3
Quiz
•
KG - Professional Dev...

20 questions
ROUNDING DECIMALS
Quiz
•
5th - 6th Grade

22 questions
Graphical Displays
Quiz
•
6th - 7th Grade

16 questions
Thousandths
Quiz
•
4th - 6th Grade

20 questions
Quiz z działu "Liczby i działania".
Quiz
•
6th Grade
Popular Resources on Wayground

15 questions
Fractions on a Number Line
Quiz
•
3rd Grade

20 questions
Equivalent Fractions
Quiz
•
3rd Grade

25 questions
Multiplication Facts
Quiz
•
5th Grade

54 questions
Analyzing Line Graphs & Tables
Quiz
•
4th Grade

22 questions
fractions
Quiz
•
3rd Grade

20 questions
Main Idea and Details
Quiz
•
5th Grade

20 questions
Context Clues
Quiz
•
6th Grade

15 questions
Equivalent Fractions
Quiz
•
4th Grade
Discover more resources for Mathematics

15 questions
Distributive Property & Review
Quiz
•
6th Grade

20 questions
Writing Algebraic Expressions
Quiz
•
6th Grade

20 questions
Ratios/Rates and Unit Rates
Quiz
•
6th Grade

20 questions
Graphing Inequalities on a Number Line
Quiz
•
6th - 9th Grade

20 questions
One Step Equations
Quiz
•
6th Grade

10 questions
Solving One Step Inequalities
Quiz
•
6th Grade

20 questions
graphing inequalities
Quiz
•
6th - 7th Grade

15 questions
One- Step Equations
Quiz
•
6th Grade


