
Pie Charts/Circle Graphs
6th - 8th Grade
•25 Qs

Similar activities
Quiz 2
8th Grade
•20 Qs
Polygons & Angles
7th Grade
•20 Qs
Year 9 - Measurement Revision Quiz 1 TAWA COLLEGE
3rd - 7th Grade
•20 Qs
سابع خطوتين
7th Grade
•20 Qs
Ratios & Proportions
6th Grade
•20 Qs
Indices-(O'Level Revision)
8th - 10th Grade
•20 Qs
Intro to Integers
6th - 7th Grade
•20 Qs
Week 41 Revision Quiz Add Subtract Fractions
7th Grade
•20 Qs

Pie Charts/Circle Graphs
Quiz
•
Mathematics
•
6th - 8th Grade
•
Medium
+4
Standards-aligned

Theresa Reedy
Used 16+ times
FREE Resource
Enhance your content in a minute
25 questions
Show all answers
1.
MULTIPLE CHOICE QUESTION
2 mins • 1 pt

32 people went to a ice hockey match. The pie chart shows the colours of their shirts. How many people wore black?
45
1
4
2.
MULTIPLE CHOICE QUESTION
2 mins • 1 pt
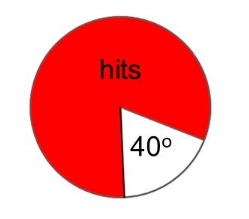
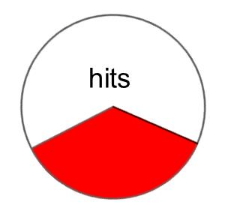
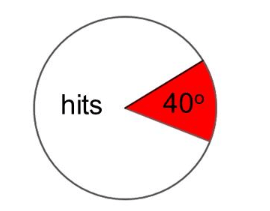
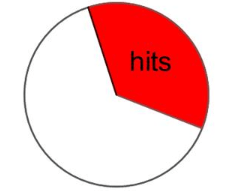
A darts player hits his target 40% of the time. Which pie chart represents his hits and misses?
3.
MULTIPLE CHOICE QUESTION
2 mins • 1 pt

What is the ratio of tables to chairs?
3:1
3:4
Tags
CCSS.6.RP.A.1
CCSS.6.RP.A.2
4.
MULTIPLE CHOICE QUESTION
2 mins • 1 pt

This pie chart shows the colour of hats that Tom owns. Which colour hat does he own the second most of?
red
blue
green
yellow
5.
MULTIPLE CHOICE QUESTION
2 mins • 1 pt

This pie chart shows the colour of hats that Tim owns. What fraction of Tim's hats are blue?
impossible to say
Tags
CCSS.3.NF.A.1
CCSS.3.NF.A.2B
6.
MULTIPLE CHOICE QUESTION
2 mins • 1 pt

These pie charts show how people travel to work in 2 towns. In which town do more people travel to work by bike?
town A
town B
both the same
impossible to say
7.
MULTIPLE CHOICE QUESTION
2 mins • 1 pt
Percentages are always out of ___ % and percentages are used in the same way as decimals and fractions.
50
100
200
1000
Answer explanation
100% is the highest value and 0 % is the lowest. A phone charge will be between 0 and 100%. Anything above 100% like 111% is not a correct percentag.


Create a free account and access millions of resources
Create resources
Host any resource
Get auto-graded reports
Continue with Google

Continue with Email
Continue with Classlink
Continue with Clever
or continue with
Microsoft
%20(1).png)
Apple
Others
Already have an account?
Similar Resources on Wayground
20 questions
Year 7 Maths quiz 2
Quiz
•
7th Grade
20 questions
Scientific Notation
Quiz
•
7th Grade
20 questions
Introduction to integers
Quiz
•
7th Grade
20 questions
Telling Time in 12-h and 24-h
Quiz
•
5th - 6th Grade
20 questions
Correlation Review
Quiz
•
8th - 10th Grade
20 questions
TEST OF AREAS AND PERIMETERS
Quiz
•
6th - 7th Grade
20 questions
Algebraic Expressions 23rd June
Quiz
•
6th Grade
20 questions
week 5 online weekend homework (quizzez)
Quiz
•
8th Grade
Popular Resources on Wayground
5 questions
This is not a...winter edition (Drawing game)
Quiz
•
1st - 5th Grade
25 questions
Multiplication Facts
Quiz
•
5th Grade
10 questions
Identify Iconic Christmas Movie Scenes
Interactive video
•
6th - 10th Grade
20 questions
Christmas Trivia
Quiz
•
6th - 8th Grade
18 questions
Kids Christmas Trivia
Quiz
•
KG - 5th Grade
11 questions
How well do you know your Christmas Characters?
Lesson
•
3rd Grade
14 questions
Christmas Trivia
Quiz
•
5th Grade
20 questions
How the Grinch Stole Christmas
Quiz
•
5th Grade
Discover more resources for Mathematics
10 questions
Identify Iconic Christmas Movie Scenes
Interactive video
•
6th - 10th Grade
15 questions
Solving Equations with Variables on Both Sides Review
Quiz
•
8th Grade
21 questions
Convert Fractions, Decimals, and Percents
Quiz
•
6th Grade
20 questions
Solving Systems of Equations by Graphing
Quiz
•
8th Grade
20 questions
Exponents
Quiz
•
6th Grade
15 questions
Christmas Movie Trivia
Quiz
•
7th Grade
25 questions
Christmas Trivia
Quiz
•
8th Grade
20 questions
Scatter Plots and Line of Best Fit
Quiz
•
8th Grade