Probability Tree Diagrams
Authored by Shannon Dolen
Mathematics
7th Grade
CCSS covered
Used 2+ times

AI Actions
Add similar questions
Adjust reading levels
Convert to real-world scenario
Translate activity
More...
Content View
Student View
15 questions
Show all answers
1.
MULTIPLE CHOICE QUESTION
5 mins • 1 pt

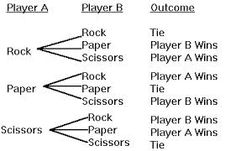
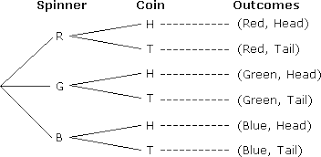
The tree diagram shows the outcomes of rolling a die and flipping a coin.
How many total outcomes are there?
Tags
CCSS.7.SP.C.8B
2.
MULTIPLE CHOICE QUESTION
5 mins • 1 pt

How many total outfit options are represented?
3.
MULTIPLE CHOICE QUESTION
5 mins • 1 pt
The cafeteria is serving three kinds of sandwiches: tuna (T), chicken, (C), and peanut butter (P). They are also serving a choice of two drinks: milk (M) or water (W). Which shows the complete set of possible combinations?
Tags
CCSS.7.SP.C.8B
4.
MULTIPLE CHOICE QUESTION
5 mins • 1 pt
You have a 3 tops, 2 pants and 2 shoes. How many total outfit options are represented?
12 outfits
22 outfits
3 outfits
7 outfits
5.
MULTIPLE CHOICE QUESTION
5 mins • 1 pt
Which tree diagram has the most possible outcomes?
Tags
CCSS.7.SP.C.8B
6.
MULTIPLE CHOICE QUESTION
5 mins • 1 pt
How many outcomes are there with tossing a coin and rolling a dice?
7.
MULTIPLE CHOICE QUESTION
5 mins • 1 pt

Which shows the sample space for flipping two coins?
Tags
CCSS.7.SP.C.8B


Access all questions and much more by creating a free account
Create resources
Host any resource
Get auto-graded reports
Continue with Google

Continue with Email
Continue with Classlink
Continue with Clever
or continue with
Microsoft
%20(1).png)
Apple
Others
Already have an account?
