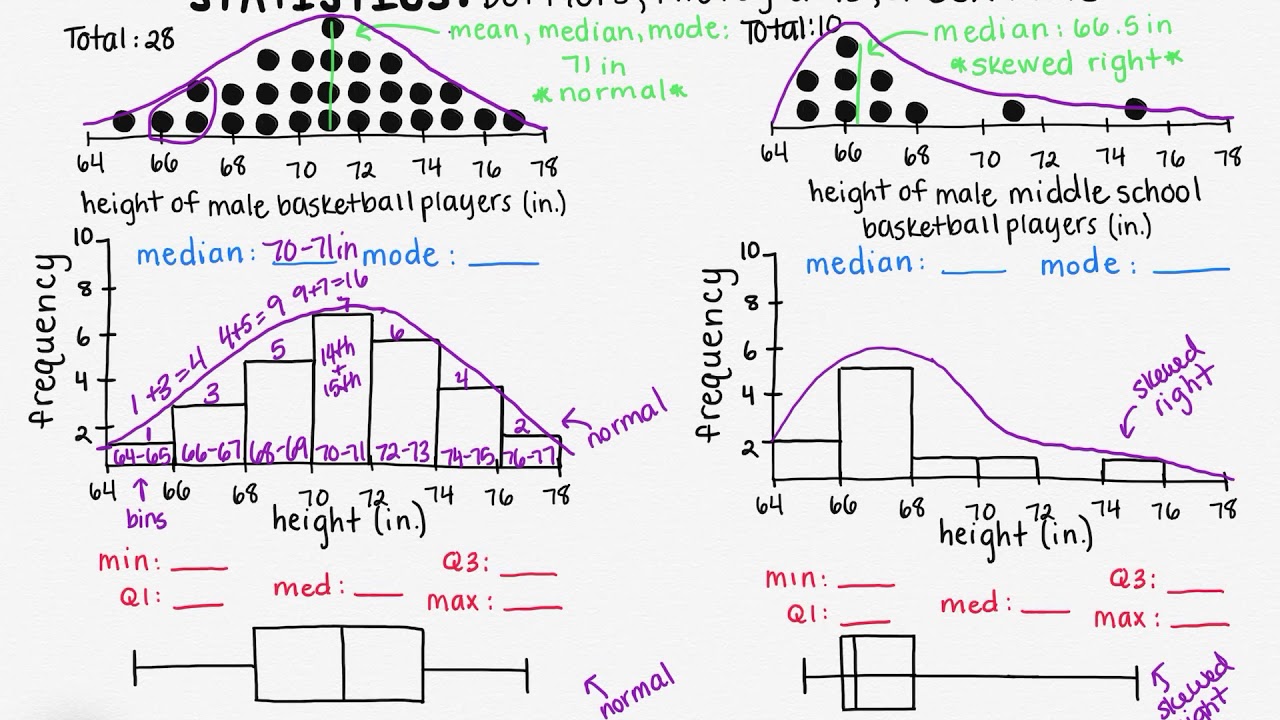
Understanding Dot Plots, Histograms, and Box Plots
Interactive Video
•
Mathematics
•
6th - 10th Grade
•
Practice Problem
•
Hard
+1
Standards-aligned

Wayground Content
FREE Resource
Enhance your content in a minute
10 questions
Show all answers
1.
MULTIPLE CHOICE QUESTION
30 sec • 1 pt
What are the three ways to display the same data discussed in the video?
Dot plots, histograms, and box plots
Line graphs, bar charts, and pie charts
Scatter plots, area charts, and radar charts
Waterfall charts, funnel charts, and heat maps
Tags
CCSS.6.SP.B.4
2.
MULTIPLE CHOICE QUESTION
30 sec • 1 pt
What shape indicates a normal distribution in a dot plot?
Linear descending line
Linear ascending line
Asymmetrical curve
Symmetrical bell-shaped curve
Tags
CCSS.6.SP.B.4
CCSS.HSS.ID.A.1
3.
MULTIPLE CHOICE QUESTION
30 sec • 1 pt
How is a normal distribution identified in a box plot?
By the number of outliers
By the symmetry of the box and equal branch lengths
By the length of the whiskers
By the size of the box
Tags
CCSS.6.SP.A.2
CCSS.6.SP.B.4
CCSS.6.SP.B.5
4.
MULTIPLE CHOICE QUESTION
30 sec • 1 pt
What does a skewed right distribution look like in a histogram?
Uniform bar heights
Tail on the right side
Descending bar heights from left to right
Tail on the left side
Tags
CCSS.6.SP.A.2
CCSS.6.SP.B.4
5.
MULTIPLE CHOICE QUESTION
30 sec • 1 pt
What does a stretched out side on a box plot indicate?
A uniform distribution
A skewed distribution
A normal distribution
An undefined distribution
Tags
CCSS.6.SP.B.4
CCSS.HSS.ID.A.1
6.
MULTIPLE CHOICE QUESTION
30 sec • 1 pt
Why can't the mean be accurately calculated using a histogram?
All data values are the same
Individual data values are not distinguishable
Histograms are only for categorical data
Histograms only show the mode
Tags
CCSS.6.SP.B.4
CCSS.HSS.ID.A.1
7.
MULTIPLE CHOICE QUESTION
30 sec • 1 pt
What indicates the mode in a histogram?
The last bar
The first bar
The shortest bar
The tallest bar
Tags
CCSS.6.SP.B.4
CCSS.HSS.ID.A.1
Create a free account and access millions of resources
Create resources
Host any resource
Get auto-graded reports

Continue with Google

Continue with Email

Continue with Classlink

Continue with Clever
or continue with

Microsoft
%20(1).png)
Apple
Others
Already have an account?
Similar Resources on Wayground

0 questions
Physics Magnetism 9th Grade
Quiz
•

0 questions
Plotting Points Review
Quiz
•

0 questions
TEKS.MATH.3.2D
Quiz
•

0 questions
Operations on complex numbers
Quiz
•

0 questions
TEKS.MATH.3.3A
Quiz
•

0 questions
CCSS.Math.Content.HSG.CO.C.9
Quiz
•

0 questions
Classifying Shapes Vocabulary
Quiz
•

0 questions
CCSS.ELA.Content.L.6.5
Quiz
•
Popular Resources on Wayground

5 questions
This is not a...winter edition (Drawing game)
Quiz
•
1st - 5th Grade

25 questions
Multiplication Facts
Quiz
•
5th Grade

10 questions
Identify Iconic Christmas Movie Scenes
Interactive video
•
6th - 10th Grade

20 questions
Christmas Trivia
Quiz
•
6th - 8th Grade

18 questions
Kids Christmas Trivia
Quiz
•
KG - 5th Grade

11 questions
How well do you know your Christmas Characters?
Lesson
•
3rd Grade

14 questions
Christmas Trivia
Quiz
•
5th Grade

20 questions
How the Grinch Stole Christmas
Quiz
•
5th Grade
Discover more resources for Mathematics

10 questions
Identify Iconic Christmas Movie Scenes
Interactive video
•
6th - 10th Grade

15 questions
Solving Equations with Variables on Both Sides Review
Quiz
•
8th Grade

21 questions
Convert Fractions, Decimals, and Percents
Quiz
•
6th Grade

20 questions
Solving Systems of Equations by Graphing
Quiz
•
8th Grade

20 questions
Exponents
Quiz
•
6th Grade

15 questions
Christmas Movie Trivia
Quiz
•
7th Grade

25 questions
Christmas Trivia
Quiz
•
8th Grade

20 questions
Scatter Plots and Line of Best Fit
Quiz
•
8th Grade
