
Latihan Soal Diagram Kelas V SD
Authored by affif afiansyah
Mathematics, Education
5th Grade
Used 43+ times


AI Actions
Add similar questions
Adjust reading levels
Convert to real-world scenario
Translate activity
More...
Content View
Student View
17 questions
Show all answers
1.
MULTIPLE CHOICE QUESTION
2 mins • 1 pt
Penyajian data dapat dilakukan dengan diagram berikut ini, kecuali ....
Diagram Garis
Diagram Batang
Diagram Balok
Diagram Lingkaran
2.
MULTIPLE CHOICE QUESTION
2 mins • 1 pt
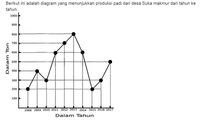
Kenaikan produksi padi tertinggi terjadi pada tahun ....
2012
2011
2010
2009
3.
MULTIPLE CHOICE QUESTION
2 mins • 1 pt

Diagram batang berikut ini menunjukkan produksi pupuk sebuah pabrik.
Selisih produksi pupuk bulan Maret dan Mei adalah...
14 ton
6 ton
4 ton
2 ton
4.
MULTIPLE CHOICE QUESTION
2 mins • 1 pt

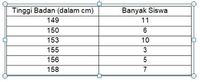
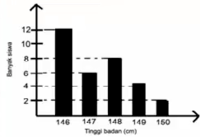
Banyak siswa yang mengikuti ulangan di kelas tersebut adalah ... anak
28
30
32
34
5.
MULTIPLE CHOICE QUESTION
2 mins • 1 pt

Diagram di atas menunjukkan data hasil panen padi Desa Sukamakmur selama 6 tahun. Dari data di atas hasil panen terbanyak terjadi pada tahun … .
2008
2007
2006
2005
6.
MULTIPLE CHOICE QUESTION
2 mins • 1 pt
Berikut yang merupakan penyajian data dalam bentuk diagram batang adalah ....


7.
MULTIPLE CHOICE QUESTION
2 mins • 1 pt

Selisih produksi padi dua tahun terakhir adalah ….
5000 ton
3000 ton
100 ton
50 ton
Access all questions and much more by creating a free account
Create resources
Host any resource
Get auto-graded reports

Continue with Google

Continue with Email

Continue with Microsoft
or continue with

%20(1).png)
Apple

Others
By signing up, you agree to our Terms of Service & Privacy Policy
Already have an account?

