
- Resource Library
- Math
- Probability And Statistics
- Two Way Frequency Tables
- Two Way Frequency Tables & Percents
Two-Way Frequency Tables & Percents
Authored by Jessica Shrider
Mathematics
9th - 12th Grade
CCSS covered
Used 6+ times


AI Actions
Add similar questions
Adjust reading levels
Convert to real-world scenario
Translate activity
More...
Content View
Student View
16 questions
Show all answers
1.
MULTIPLE SELECT QUESTION
2 mins • 1 pt
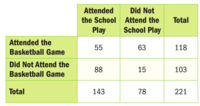
If you are asked to find the percent of people who did not attend the school play that did not attend the basketball game, what should the total be?
221
78
118
103
143
Answer explanation
Since we were asked about the percent of people who DID NOT ATTEND THE SCHOOL PLAY, that means the total is the number of people who didn't attend the school play, which is 78.
2.
MULTIPLE CHOICE QUESTION
2 mins • 1 pt
If you are asked to find the percent of people that did not attend the school play who did not attend the basketball game, what should the fraction be?
15/221
15/103
15/78
63/78
Answer explanation
From the last question, we know that the total is 78 people. Out of those 78 people (who didn't attend the play), 15 of them did not attend the basketball game. So, our fraction is 15/78.
Tags
CCSS.6.RP.A.3C
3.
MULTIPLE CHOICE QUESTION
2 mins • 1 pt
What is the percent of people who did not attend the school play who did not attend the basketball game?
23.1%
6.79%
14.6%
28.5%
Answer explanation
From the last question, we know that the fraction is 15/78.
15/78 = 0.231
0.231 * 100 = 23.1%
4.
MULTIPLE CHOICE QUESTION
2 mins • 1 pt

If you want to find the percent of eighth graders who prefer cake, what fraction should you start with?
198/431
116/431
116/220
116/198
Answer explanation
We are looking at the percent of EIGHTH GRADERS who prefer cake. That means our total is the number of eighth graders (220). Then, we just want the eighth graders who prefer cake. There are 116 of them, so our fraction is 116/220.
5.
MULTIPLE CHOICE QUESTION
2 mins • 1 pt
If you want to find the percent of students who are in seventh grade, what fraction should you use?
82/431
82/211
129/431
211/431
Answer explanation
We are looking at the percent of STUDENTS who are seventh graders. That means the number of students (431) needs to be the total. Then, we are looking at seventh graders. We don't care if they prefer cake or ice cream. So, we'll use the total number of seventh graders (211). Our fraction is 211/431.
6.
MULTIPLE CHOICE QUESTION
2 mins • 1 pt
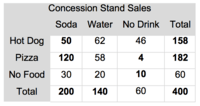
If you were asked to find which percent of people who got water ordered no food, what fraction should you use?
140/400
20/140
20/400
60/140
Answer explanation
We are looking at the percent of PEOPLE WHO GOT WATER, which makes the total 140. Then, of those people who got water, we want people who ordered no food. The number in the box "water, no food" is 20, so the fraction is 20/140.
7.
MULTIPLE CHOICE QUESTION
2 mins • 1 pt
If you were asked to find the percent of people who ordered a hot dog and a soda, which fraction should you use?
50/400
50/200
50/158
358/400
Answer explanation
We are looking for the percent of PEOPLE, so that means we need to use the total number of people (400) as the total. Then, we want people who ordered a hot dog and a soda. There are 50 people who ordered a hot dog and a soda, which makes the fraction 50/400.
Tags
CCSS.6.RP.A.3C
Access all questions and much more by creating a free account
Create resources
Host any resource
Get auto-graded reports

Continue with Google

Continue with Email

Continue with Microsoft
or continue with

%20(1).png)
Apple

Others
Already have an account?

