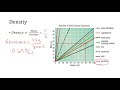
Calculating Density from Graphs
Interactive Video
•
Science
•
6th - 10th Grade
•
Practice Problem
•
Easy

Amelia Wright
Used 1+ times
FREE Resource
10 questions
Show all answers
1.
MULTIPLE CHOICE QUESTION
30 sec • 1 pt
What is the basic formula for calculating density?
Volume divided by mass
Mass divided by volume
Mass multiplied by volume
Volume minus mass
2.
MULTIPLE CHOICE QUESTION
30 sec • 1 pt
On a density graph, what does the y-axis represent?
Volume
Slope
Density
Mass
3.
MULTIPLE CHOICE QUESTION
30 sec • 1 pt
On a density graph, what does the x-axis represent?
Density
Slope
Volume
Mass
4.
MULTIPLE CHOICE QUESTION
30 sec • 1 pt
What mathematical concept is used to calculate density from a graph?
Area under the curve
Slope of the line
Intercept of the line
Curvature of the line
5.
MULTIPLE CHOICE QUESTION
30 sec • 1 pt
Why can we assume one of the points on a density graph is (0,0)?
Because all density graphs start at (0,0)
All of the above
Because it simplifies the calculation
Because it is a standard practice
6.
MULTIPLE CHOICE QUESTION
30 sec • 1 pt
In the gasoline example, what were the estimated y and x values used?
55 grams and 60 milliliters
50 grams and 80 milliliters
55 grams and 80 milliliters
50 grams and 60 milliliters
7.
MULTIPLE CHOICE QUESTION
30 sec • 1 pt
What was the calculated density of gasoline?
0.55 grams per milliliter
0.69 grams per milliliter
0.92 grams per milliliter
0.80 grams per milliliter
Access all questions and much more by creating a free account
Create resources
Host any resource
Get auto-graded reports
Continue with Google

Continue with Email
Continue with Classlink
Continue with Clever
or continue with
Microsoft
%20(1).png)
Apple
Others
Already have an account?
Similar Resources on Wayground
Popular Resources on Wayground

15 questions
Fractions on a Number Line
Quiz
•
3rd Grade
20 questions
Equivalent Fractions
Quiz
•
3rd Grade
25 questions
Multiplication Facts
Quiz
•
5th Grade
54 questions
Analyzing Line Graphs & Tables
Quiz
•
4th Grade
22 questions
fractions
Quiz
•
3rd Grade
20 questions
Main Idea and Details
Quiz
•
5th Grade
20 questions
Context Clues
Quiz
•
6th Grade
15 questions
Equivalent Fractions
Quiz
•
4th Grade
Discover more resources for Science
20 questions
Cell Organelles and Functions
Quiz
•
6th - 8th Grade
33 questions
Grade 6 Quarter 3 PMA 5 Review
Quiz
•
6th - 8th Grade
20 questions
Rocks and The Rock Cycle
Quiz
•
6th Grade
12 questions
Ecological Succession
Quiz
•
7th Grade
20 questions
Thermal Energy - Heat Transfer
Quiz
•
6th Grade
10 questions
Exploring the Rock Cycle: Types and Formation
Interactive video
•
6th - 8th Grade
10 questions
Exploring the Layers of the Earth
Interactive video
•
6th - 10th Grade
15 questions
Punnett Squares
Quiz
•
6th Grade