Algebra 1 Probability and Statistics Challenge
Interactive Video
•
Mathematics
•
6th - 10th Grade
•
Practice Problem
•
Hard
+5
Standards-aligned

Olivia Brooks
FREE Resource
Standards-aligned
Read more
10 questions
Show all answers
1.
MULTIPLE CHOICE QUESTION
30 sec • 1 pt
What is the probability of drawing a purple marble from a bag containing 4 red, 8 purple, and 6 blue marbles?
2/9
6/18
8/18
4/18
Tags
CCSS.7.SP.C.7B
2.
MULTIPLE CHOICE QUESTION
30 sec • 1 pt
If a bag contains 4 red, 8 purple, and 6 blue marbles, what is the probability of drawing a red marble?
6/18
2/9
8/18
4/18
Tags
CCSS.7.SP.C.7B
3.
MULTIPLE CHOICE QUESTION
30 sec • 1 pt
In compound probability, what operation is used when the word 'and' is involved?
Subtraction
Addition
Division
Multiplication
Tags
CCSS.HSS.CP.B.7
4.
MULTIPLE CHOICE QUESTION
30 sec • 1 pt
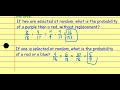
What is the probability of drawing a purple marble followed by a red marble without replacement from a bag containing 4 red, 8 purple, and 6 blue marbles?
2/9
4/17
8/18
16/153
5.
MULTIPLE CHOICE QUESTION
30 sec • 1 pt
Which measure of central tendency is defined as the average of a data set?
Median
Mode
Range
Mean
Tags
CCSS.6.SP.B.5D
CCSS.HSS.ID.A.2
6.
MULTIPLE CHOICE QUESTION
30 sec • 1 pt
How do you find the median of a data set?
Add all values and divide by the number of values
Find the most frequently occurring value
Subtract the smallest value from the largest value
Arrange the values in order and find the middle value
Tags
CCSS.6.SP.B.5C
7.
MULTIPLE CHOICE QUESTION
30 sec • 1 pt
If your grades on three exams are 80, 93, and 91, what grade do you need on the next exam to have an average of 90?
96
95
90
85
Tags
CCSS.6.EE.B.7
Access all questions and much more by creating a free account
Create resources
Host any resource
Get auto-graded reports
Continue with Google

Continue with Email
Continue with Classlink
Continue with Clever
or continue with
Microsoft
%20(1).png)
Apple
Others
Already have an account?
Popular Resources on Wayground

7 questions
History of Valentine's Day
Interactive video
•
4th Grade
15 questions
Fractions on a Number Line
Quiz
•
3rd Grade
20 questions
Equivalent Fractions
Quiz
•
3rd Grade
25 questions
Multiplication Facts
Quiz
•
5th Grade
22 questions
fractions
Quiz
•
3rd Grade
15 questions
Valentine's Day Trivia
Quiz
•
3rd Grade
20 questions
Main Idea and Details
Quiz
•
5th Grade
20 questions
Context Clues
Quiz
•
6th Grade
Discover more resources for Mathematics
20 questions
Writing Algebraic Expressions
Quiz
•
6th Grade
20 questions
Ratios/Rates and Unit Rates
Quiz
•
6th Grade
14 questions
Volume of rectangular prisms
Quiz
•
7th Grade
20 questions
Laws of Exponents
Quiz
•
8th Grade
20 questions
Graphing Inequalities on a Number Line
Quiz
•
6th - 9th Grade
20 questions
One Step Equations
Quiz
•
6th Grade
20 questions
Exponent Properties
Quiz
•
9th Grade
10 questions
Solving One Step Inequalities
Quiz
•
6th Grade