- Resource Library
- Math
- Probability And Statistics
- Normal Distribution
- Exploring Normal Distribution Concepts
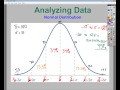
Exploring Normal Distribution Concepts
Interactive Video
•
Mathematics
•
8th - 12th Grade
•
Practice Problem
•
Medium
Standards-aligned

Aiden Montgomery
Used 17+ times
FREE Resource
Standards-aligned
Read more
10 questions
Show all answers
1.
MULTIPLE CHOICE QUESTION
30 sec • 1 pt
What is a negatively skewed data set?
A data set with no skew.
A data set where the mean and median are equal.
A data set where the mean is higher than the median.
A data set where the mean is lower than the median.
Tags
CCSS.6.SP.B.5D
CCSS.HSS.ID.A.2
2.
MULTIPLE CHOICE QUESTION
30 sec • 1 pt
Which of the following is an example of a metric that tends to follow a normal distribution?
Daily stock prices
Monthly rainfall
IQ scores
Number of cars in a parking lot
Tags
CCSS.HSS.ID.A.4
3.
MULTIPLE CHOICE QUESTION
30 sec • 1 pt
What percentage of data falls within one standard deviation of the mean in a normal distribution?
99.7%
50%
95%
68%
Tags
CCSS.HSS.ID.A.4
4.
MULTIPLE CHOICE QUESTION
30 sec • 1 pt
If the mean IQ is 100 with a standard deviation of 15, what IQ score is two standard deviations above the mean?
145
160
115
130
5.
MULTIPLE CHOICE QUESTION
30 sec • 1 pt
What percentage of data falls within two standard deviations of the mean in a normal distribution?
68%
95%
99.7%
34%
Tags
CCSS.HSS.ID.A.4
6.
MULTIPLE CHOICE QUESTION
30 sec • 1 pt
How much data falls between two and three standard deviations from the mean?
2.35%
68%
13.5%
34%
Tags
CCSS.HSS.ID.A.4
7.
MULTIPLE CHOICE QUESTION
30 sec • 1 pt
What is the total percentage of data that falls within three standard deviations of the mean?
68%
100%
95%
99.7%
Tags
CCSS.HSS.ID.A.4
Access all questions and much more by creating a free account
Create resources
Host any resource
Get auto-graded reports
Continue with Google

Continue with Email
Continue with Classlink
Continue with Clever
or continue with
Microsoft
%20(1).png)
Apple
Others
Already have an account?
