Exploring Distance-Time Graphs and Speed
Interactive Video
•
Science
•
6th - 10th Grade
•
Practice Problem
•
Medium
Standards-aligned

Amelia Wright
Used 16+ times
FREE Resource
Standards-aligned
Read more
10 questions
Show all answers
1.
MULTIPLE CHOICE QUESTION
30 sec • 1 pt
What is the name of the jogger introduced in the video?
Mr. Brown
Mr. Grey
Mr. Grayson
Mr. Green
2.
MULTIPLE CHOICE QUESTION
30 sec • 1 pt
On a distance-time graph, what does the y-axis represent?
Acceleration
Speed
Distance
Time
3.
MULTIPLE CHOICE QUESTION
30 sec • 1 pt
What does a straight sloping line on a distance-time graph indicate?
Acceleration
Changing speed
Stationary object
Constant speed
4.
MULTIPLE CHOICE QUESTION
30 sec • 1 pt
How do you calculate speed from a distance-time graph?
Speed = Distance + Time
Speed = Distance / Time
Speed = Distance x Time
Speed = Time / Distance
5.
MULTIPLE CHOICE QUESTION
30 sec • 1 pt
If a jogger travels 60 meters in 30 seconds, what is his speed?
2 m/s
4 m/s
1 m/s
3 m/s
Tags
NGSS.MS-PS3-1
6.
MULTIPLE CHOICE QUESTION
30 sec • 1 pt
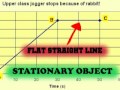
What does a flat horizontal line on a distance-time graph signify?
Constant speed
Changing speed
Stationary object
Acceleration
7.
MULTIPLE CHOICE QUESTION
30 sec • 1 pt
How long did the jogger remain stationary during the video?
40 seconds
30 seconds
20 seconds
10 seconds
Access all questions and much more by creating a free account
Create resources
Host any resource
Get auto-graded reports
Continue with Google

Continue with Email
Continue with Classlink
Continue with Clever
or continue with
Microsoft
%20(1).png)
Apple
Others
Already have an account?
Similar Resources on Wayground

11 questions
Exploring Kepler's Laws of Planetary Motion
Interactive video
•
6th - 10th Grade
11 questions
Exploring Science Tools for Students
Interactive video
•
6th - 10th Grade
11 questions
Crafting the Experimental Design FRQ for AP Environmental Science
Interactive video
•
6th - 10th Grade
11 questions
Exploring the Science of Friction and Motion
Interactive video
•
6th - 10th Grade
Popular Resources on Wayground
7 questions
History of Valentine's Day
Interactive video
•
4th Grade
15 questions
Fractions on a Number Line
Quiz
•
3rd Grade
20 questions
Equivalent Fractions
Quiz
•
3rd Grade
25 questions
Multiplication Facts
Quiz
•
5th Grade
22 questions
fractions
Quiz
•
3rd Grade
15 questions
Valentine's Day Trivia
Quiz
•
3rd Grade
20 questions
Main Idea and Details
Quiz
•
5th Grade
20 questions
Context Clues
Quiz
•
6th Grade
Discover more resources for Science
11 questions
Valentines Day
Quiz
•
6th - 8th Grade
25 questions
Valentine's Day Trivia
Quiz
•
8th Grade
20 questions
Cell Organelles and Functions
Quiz
•
6th - 8th Grade
20 questions
Rocks and The Rock Cycle
Quiz
•
6th Grade
8 questions
Newton's Second Law
Lesson
•
6th - 8th Grade
20 questions
Thermal Energy - Heat Transfer
Quiz
•
6th Grade
10 questions
Exploring the Rock Cycle: Types and Formation
Interactive video
•
6th - 8th Grade
10 questions
Carbon Cycle
Lesson
•
6th - 8th Grade