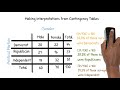
Interpreting Contingency Tables and Their Distributions
Interactive Video
•
Mathematics
•
8th - 12th Grade
•
Practice Problem
•
Medium
Standards-aligned

Sophia Harris
Used 1+ times
FREE Resource
Standards-aligned
Read more
10 questions
Show all answers
1.
MULTIPLE CHOICE QUESTION
30 sec • 1 pt
What is one method mentioned for interpreting data from contingency tables?
Creating line graphs
Using scatter plots
Drawing side-by-side bar graphs
Using pie charts
Tags
CCSS.8.SP.A.4
2.
MULTIPLE CHOICE QUESTION
30 sec • 1 pt
What does marginal distribution help us understand?
The relationship between two variables
The distribution of a specific category
Percentages calculated from the margins of the table
The total number of people surveyed
Tags
CCSS.8.SP.A.4
3.
MULTIPLE CHOICE QUESTION
30 sec • 1 pt
How do you calculate the percentage of a category in marginal distribution?
Divide the category count by the total count and multiply by 100
Subtract the category count from the total count
Multiply the category count by the total count
Add the category count to the total count
Tags
CCSS.8.SP.A.4
4.
MULTIPLE CHOICE QUESTION
30 sec • 1 pt
What does conditional distribution focus on?
The entire sample
The margins of the table
A specific category or categories
The total number of people surveyed
Tags
CCSS.8.SP.A.4
5.
MULTIPLE CHOICE QUESTION
30 sec • 1 pt
In the example given, what percentage of independent voters are male?
37.3%
45.7%
31.4%
62.7%
Tags
CCSS.8.SP.A.4
6.
MULTIPLE CHOICE QUESTION
30 sec • 1 pt
What percentage of independent voters are female in the given example?
62.7%
45.7%
31.4%
37.3%
Tags
CCSS.8.SP.A.4
7.
MULTIPLE CHOICE QUESTION
30 sec • 1 pt
What does the example of independent voters illustrate about conditional distributions?
They provide insight into how categories are broken up
They show the total number of people surveyed
They are the same as marginal distributions
They focus on the margins of the table
Tags
CCSS.8.SP.A.4
Access all questions and much more by creating a free account
Create resources
Host any resource
Get auto-graded reports
Continue with Google

Continue with Email
Continue with Classlink
Continue with Clever
or continue with
Microsoft
%20(1).png)
Apple
Others
Already have an account?
Popular Resources on Wayground

15 questions
Fractions on a Number Line
Quiz
•
3rd Grade
10 questions
Probability Practice
Quiz
•
4th Grade
15 questions
Probability on Number LIne
Quiz
•
4th Grade
20 questions
Equivalent Fractions
Quiz
•
3rd Grade
25 questions
Multiplication Facts
Quiz
•
5th Grade
22 questions
fractions
Quiz
•
3rd Grade
6 questions
Appropriate Chromebook Usage
Lesson
•
7th Grade
10 questions
Greek Bases tele and phon
Quiz
•
6th - 8th Grade
Discover more resources for Mathematics
23 questions
TSI Math Vocabulary
Quiz
•
10th - 12th Grade
15 questions
Graphing Inequalities
Quiz
•
7th - 9th Grade
20 questions
Graphing Inequalities on a Number Line
Quiz
•
6th - 9th Grade
8 questions
8th U5L20 Volume of Sphere
Quiz
•
8th Grade
20 questions
Solving Systems of Equations Review
Quiz
•
8th Grade
20 questions
Slope from a Graph
Quiz
•
8th Grade
15 questions
Combine Like Terms and Distributive Property
Quiz
•
8th - 9th Grade
10 questions
Plotting Points on a Coordinate Plane: Quadrant 1 Essentials
Interactive video
•
6th - 10th Grade