Comparing Data Visualization Techniques: Dot Plots, Histograms, and Box Plots
Interactive Video
•
Mathematics
•
6th - 10th Grade
•
Practice Problem
•
Hard
+1
Standards-aligned

Aiden Montgomery
FREE Resource
Standards-aligned
Read more
10 questions
Show all answers
1.
MULTIPLE CHOICE QUESTION
30 sec • 1 pt
Can a histogram be used to accurately find the median?
No, because it lacks precise data points
Yes, always
Yes, but only with additional information
No, unless it's a cumulative histogram
Tags
CCSS.6.SP.B.4
CCSS.HSS.ID.A.1
2.
MULTIPLE CHOICE QUESTION
30 sec • 1 pt
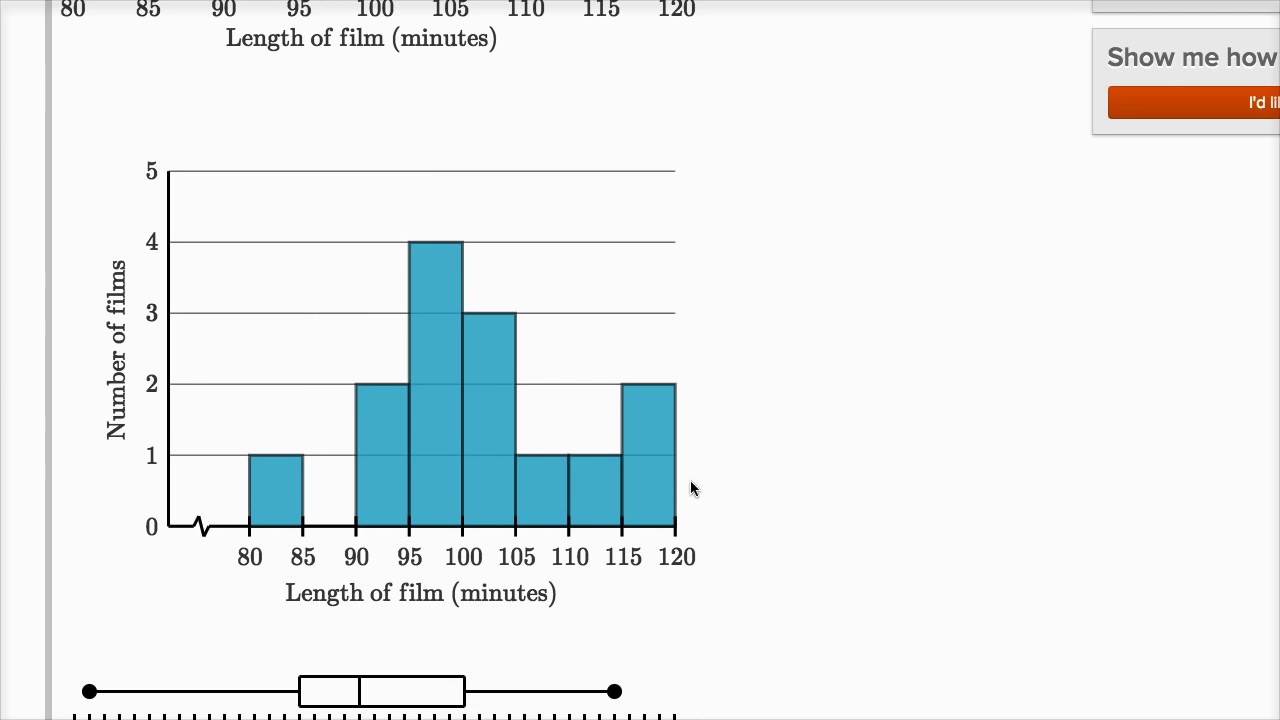
How many Pixar films had a running time of 96 minutes?
1
2
3
4
Tags
CCSS.3.MD.B.4
3.
MULTIPLE CHOICE QUESTION
30 sec • 1 pt
Is it possible to list all individual data points using a histogram?
Yes, easily
No, it's not specific enough
Yes, but with some difficulty
No, unless the histogram is very detailed
Tags
CCSS.6.SP.B.4
CCSS.HSS.ID.A.1
4.
MULTIPLE CHOICE QUESTION
30 sec • 1 pt
Why might a dot plot be useful for finding the median?
It shows data distribution
It lists all data points
It visually represents the median
It groups data into intervals
Tags
CCSS.6.SP.B.4
CCSS.HSS.ID.A.1
5.
MULTIPLE CHOICE QUESTION
30 sec • 1 pt
Which type of data representation explicitly indicates the median?
Box plot
Dot plot
Histogram
Bar chart
6.
MULTIPLE CHOICE QUESTION
30 sec • 1 pt
What is the median running time of Pixar's first 14 films according to the box plot?
99 minutes
96 minutes
95 minutes
100 minutes
Tags
CCSS.6.SP.B.4
CCSS.HSS.ID.A.1
7.
MULTIPLE CHOICE QUESTION
30 sec • 1 pt
How many vehicles had driven more than 200,000 kilometers?
6
3
4
5
Tags
CCSS.2.MD.D.9
CCSS.3.MD.B.4
Access all questions and much more by creating a free account
Create resources
Host any resource
Get auto-graded reports
Continue with Google

Continue with Email
Continue with Classlink
Continue with Clever
or continue with
Microsoft
%20(1).png)
Apple
Others
Already have an account?
Similar Resources on Wayground
Popular Resources on Wayground

15 questions
Fractions on a Number Line
Quiz
•
3rd Grade
20 questions
Equivalent Fractions
Quiz
•
3rd Grade
25 questions
Multiplication Facts
Quiz
•
5th Grade
54 questions
Analyzing Line Graphs & Tables
Quiz
•
4th Grade
22 questions
fractions
Quiz
•
3rd Grade
20 questions
Main Idea and Details
Quiz
•
5th Grade
20 questions
Context Clues
Quiz
•
6th Grade
15 questions
Equivalent Fractions
Quiz
•
4th Grade
Discover more resources for Mathematics
22 questions
distributive property
Quiz
•
7th Grade
18 questions
Angle Relationships
Quiz
•
7th Grade
15 questions
Distributive Property & Review
Quiz
•
6th Grade
20 questions
Writing Algebraic Expressions
Quiz
•
6th Grade
20 questions
How Some Friendships Last — and Others Don’t Video Questions
Quiz
•
7th Grade
14 questions
finding slope from a graph
Quiz
•
8th Grade
20 questions
Ratios/Rates and Unit Rates
Quiz
•
6th Grade
18 questions
Handbook Refresher Quiz
Quiz
•
7th Grade