Exploring Basic Graph Types in Probability and Statistics
Interactive Video
•
Mathematics
•
9th - 12th Grade
•
Practice Problem
•
Hard
Standards-aligned

Jackson Turner
FREE Resource
Standards-aligned
Read more
10 questions
Show all answers
1.
MULTIPLE CHOICE QUESTION
30 sec • 1 pt
Which type of graph typically represents discrete data?
Pie chart
Histogram
Line graph
Scatter plot
2.
MULTIPLE CHOICE QUESTION
30 sec • 1 pt
What does a continuous graph usually feature?
Unconnected points
Connected lines
Text labels
Separate categories
3.
MULTIPLE CHOICE QUESTION
30 sec • 1 pt
What type of data is represented by a pie chart?
Ordinal
Quantitative
Qualitative
Discrete
4.
MULTIPLE CHOICE QUESTION
30 sec • 1 pt
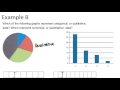
Which graph is always considered to represent qualitative data?
Bar graph
Line graph
Histogram
Box plot
5.
MULTIPLE CHOICE QUESTION
30 sec • 1 pt
Which graph type is inherently quantitative?
Bar graph
Line graph
Pie chart
Stem and leaf plot
6.
MULTIPLE CHOICE QUESTION
30 sec • 1 pt
What does a histogram typically display?
Categories
Textual data
Continuous data
Discrete data
Tags
CCSS.6.SP.B.4
CCSS.HSS.ID.A.1
7.
MULTIPLE CHOICE QUESTION
30 sec • 1 pt
What type of data do stem and leaf plots represent?
Qualitative
Quantitative
None of the above
Categorical
Access all questions and much more by creating a free account
Create resources
Host any resource
Get auto-graded reports
Continue with Google

Continue with Email
Continue with Classlink
Continue with Clever
or continue with
Microsoft
%20(1).png)
Apple
Others
Already have an account?
Similar Resources on Wayground

8 questions
Learn More About the North American Computational Linguistics Olympiad
Interactive video
•
9th - 12th Grade
6 questions
Coronavirus Model Predicts U.S. Death Toll Of Over 200,000 By October
Interactive video
•
9th - 12th Grade
6 questions
Find the parabola given the vertex and point
Interactive video
•
9th - 10th Grade
Popular Resources on Wayground
15 questions
Fractions on a Number Line
Quiz
•
3rd Grade
20 questions
Equivalent Fractions
Quiz
•
3rd Grade
25 questions
Multiplication Facts
Quiz
•
5th Grade
22 questions
fractions
Quiz
•
3rd Grade
20 questions
Main Idea and Details
Quiz
•
5th Grade
20 questions
Context Clues
Quiz
•
6th Grade
15 questions
Equivalent Fractions
Quiz
•
4th Grade
20 questions
Figurative Language Review
Quiz
•
6th Grade
Discover more resources for Mathematics
20 questions
Graphing Inequalities on a Number Line
Quiz
•
6th - 9th Grade
12 questions
Exponential Growth and Decay
Quiz
•
9th Grade
20 questions
Exponent Rules Review
Quiz
•
8th - 9th Grade
25 questions
Complementary and Supplementary Angles
Quiz
•
7th - 10th Grade
12 questions
Add and Subtract Polynomials
Quiz
•
9th - 12th Grade
13 questions
Model Exponential Growth and Decay Scenarios
Quiz
•
9th - 12th Grade
15 questions
Combine Like Terms and Distributive Property
Quiz
•
8th - 9th Grade
27 questions
7.2.3 Quadrilateral Properties
Quiz
•
9th - 12th Grade