Exploring Histograms in Unit 10, Lesson 4
Interactive Video
•
Mathematics
•
6th - 10th Grade
•
Practice Problem
•
Medium
+2
Standards-aligned

Ethan Morris
Used 13+ times
FREE Resource
Standards-aligned
Read more
10 questions
Show all answers
1.
MULTIPLE CHOICE QUESTION
30 sec • 1 pt
What do histograms represent in their bars?
Data in intervals or ranges
Percentage of total data
Individual data points
Cumulative data over time
Tags
CCSS.6.SP.B.4
CCSS.HSS.ID.A.1
2.
MULTIPLE CHOICE QUESTION
30 sec • 1 pt
Which statement is true about histograms?
They can represent data in intervals.
They are used only for time series data.
Bars do not touch each other.
Bars represent individual data points.
Tags
CCSS.6.SP.B.4
CCSS.HSS.ID.A.1
3.
MULTIPLE CHOICE QUESTION
30 sec • 1 pt
What is the primary difference between bar graphs and histograms?
Bar graphs represent categories, histograms represent intervals.
Histograms have bars that do not touch.
Histograms cannot show changes over time.
Bar graphs can only show positive values.
Tags
CCSS.6.SP.B.4
CCSS.HSS.ID.A.1
4.
MULTIPLE CHOICE QUESTION
30 sec • 1 pt
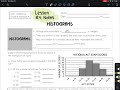
How is the total number of scores in the ACT exam data set determined?
By adding the frequency of all bars
By multiplying the number of bars by the average frequency
By finding the tallest bar
By counting the bars
Tags
CCSS.6.SP.B.5A
5.
MULTIPLE CHOICE QUESTION
30 sec • 1 pt
Which score range had 17 scores in the ACT exam histogram?
16 to 20
11 to 15
1 to 5
6 to 10
Tags
CCSS.6.SP.B.4
CCSS.HSS.ID.A.1
6.
MULTIPLE CHOICE QUESTION
30 sec • 1 pt
What percentage of scores fell into the 21 to 25 range in the ACT exam histogram?
17%
28%
34%
62%
Tags
CCSS.6.SP.B.4
CCSS.HSS.ID.A.1
7.
MULTIPLE CHOICE QUESTION
30 sec • 1 pt
How many library patrons were surveyed in the local library histogram?
23
40
50
100
Tags
CCSS.6.SP.B.5A
Access all questions and much more by creating a free account
Create resources
Host any resource
Get auto-graded reports
Continue with Google

Continue with Email
Continue with Classlink
Continue with Clever
or continue with
Microsoft
%20(1).png)
Apple
Others
Already have an account?
Popular Resources on Wayground

7 questions
History of Valentine's Day
Interactive video
•
4th Grade
15 questions
Fractions on a Number Line
Quiz
•
3rd Grade
20 questions
Equivalent Fractions
Quiz
•
3rd Grade
25 questions
Multiplication Facts
Quiz
•
5th Grade
22 questions
fractions
Quiz
•
3rd Grade
15 questions
Valentine's Day Trivia
Quiz
•
3rd Grade
20 questions
Main Idea and Details
Quiz
•
5th Grade
20 questions
Context Clues
Quiz
•
6th Grade
Discover more resources for Mathematics
20 questions
Writing Algebraic Expressions
Quiz
•
6th Grade
20 questions
Ratios/Rates and Unit Rates
Quiz
•
6th Grade
14 questions
Volume of rectangular prisms
Quiz
•
7th Grade
20 questions
Laws of Exponents
Quiz
•
8th Grade
20 questions
Graphing Inequalities on a Number Line
Quiz
•
6th - 9th Grade
20 questions
One Step Equations
Quiz
•
6th Grade
20 questions
Exponent Properties
Quiz
•
9th Grade
10 questions
Solving One Step Inequalities
Quiz
•
6th Grade