Exploring Scatter Plots and Lines of Best Fit
Interactive Video
•
Mathematics
•
6th - 10th Grade
•
Practice Problem
•
Medium
+3
Standards-aligned

Aiden Montgomery
Used 56+ times
FREE Resource
Standards-aligned
Read more
10 questions
Show all answers
1.
MULTIPLE CHOICE QUESTION
30 sec • 1 pt
What do scatterplots help us to understand?
Data without any patterns
Historical data without trends
Exact values only
Trends in data
Tags
CCSS.HSF.IF.B.4
2.
MULTIPLE CHOICE QUESTION
30 sec • 1 pt
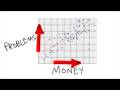
What is true about the relationship between money and problems according to the scatterplot shown?
No relationship
More money, more problems
Data is inconclusive
More money, fewer problems
Tags
CCSS.HSF-LE.A.1B
3.
MULTIPLE CHOICE QUESTION
30 sec • 1 pt
Which type of scatterplot was not covered in the tutorial?
Crowded scatterplots
Multiple sets, crowded, and 3D
3D scatterplots
Multiple sets and crowded
Tags
CCSS.8.SP.A.1
4.
MULTIPLE CHOICE QUESTION
30 sec • 1 pt
For future estimates in the tree height scatterplot, which line should we use?
Line of symmetry
Horizontal line
Line of best fit
Vertical line
Tags
CCSS.8.EE.B.5
5.
MULTIPLE CHOICE QUESTION
30 sec • 1 pt
What does the line of best fit represent in a scatterplot?
Symmetry in data
A division between data sets
A trend in the data
The exact path of data points
Tags
CCSS.8.SP.A.2
6.
MULTIPLE CHOICE QUESTION
30 sec • 1 pt
What is the primary purpose of using a line of best fit in scatterplots?
To create symmetry in the data
To connect all the data points
To estimate future data points
To draw attention to outliers
Tags
CCSS.8.SP.A.2
7.
MULTIPLE CHOICE QUESTION
30 sec • 1 pt
In the new restaurants scatterplot, what is the estimated number of restaurants in 2008?
18
16
15
13
Tags
CCSS.HSF.LE.B.5
Access all questions and much more by creating a free account
Create resources
Host any resource
Get auto-graded reports
Continue with Google

Continue with Email
Continue with Classlink
Continue with Clever
or continue with
Microsoft
%20(1).png)
Apple
Others
Already have an account?
