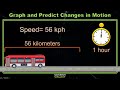
Graphing and Predicting Motion Changes
Interactive Video
•
Mathematics
•
1st - 5th Grade
•
Practice Problem
•
Hard
+2
Standards-aligned

Ethan Morris
Used 5+ times
FREE Resource
Standards-aligned
Read more
10 questions
Show all answers
1.
MULTIPLE CHOICE QUESTION
30 sec • 1 pt
What is motion defined as in physics?
The speed of an object
The movement of an object in relation to another object
The force applied on an object
The displacement of an object over time
2.
MULTIPLE CHOICE QUESTION
30 sec • 1 pt
How is speed calculated?
Distance multiplied by time
Time divided by distance
Distance divided by time
Speed is a constant value
Tags
CCSS.8.EE.C.7B
3.
MULTIPLE CHOICE QUESTION
30 sec • 1 pt
What unit of measurement is commonly used for speed in the United States?
Meters per second
Feet per second
Kilometers per hour
Miles per hour
Tags
CCSS.6.RP.A.3B
4.
MULTIPLE CHOICE QUESTION
30 sec • 1 pt
Which countries were mentioned as using kilometers per hour for speed?
Australia, New Zealand, Japan
India, Russia, Brazil
Germany, France, Sweden, China
United States, Canada, Mexico
5.
MULTIPLE CHOICE QUESTION
30 sec • 1 pt
In scientific contexts, what units are primarily used to measure speed?
Miles and minutes
Kilometers and hours
Meters and seconds
Feet and seconds
6.
MULTIPLE CHOICE QUESTION
30 sec • 1 pt
If a toy car travels 8 meters in 4 seconds, what is its speed?
8 meters per second
2 meters per second
4 meters per second
12 meters per second
Tags
CCSS.HSG.MG.A.2
7.
MULTIPLE CHOICE QUESTION
30 sec • 1 pt
On a speed-time graph, what does a flat line represent?
The object is accelerating
The object has stopped moving
The object is moving at a constant speed
The object is decelerating
Tags
CCSS.HSF.IF.B.4
Access all questions and much more by creating a free account
Create resources
Host any resource
Get auto-graded reports
Continue with Google

Continue with Email
Continue with Classlink
Continue with Clever
or continue with
Microsoft
%20(1).png)
Apple
Others
Already have an account?
Popular Resources on Wayground

15 questions
Fractions on a Number Line
Quiz
•
3rd Grade
20 questions
Equivalent Fractions
Quiz
•
3rd Grade
25 questions
Multiplication Facts
Quiz
•
5th Grade
54 questions
Analyzing Line Graphs & Tables
Quiz
•
4th Grade
22 questions
fractions
Quiz
•
3rd Grade
20 questions
Main Idea and Details
Quiz
•
5th Grade
20 questions
Context Clues
Quiz
•
6th Grade
15 questions
Equivalent Fractions
Quiz
•
4th Grade
Discover more resources for Mathematics
15 questions
Fractions on a Number Line
Quiz
•
3rd Grade
20 questions
Equivalent Fractions
Quiz
•
3rd Grade
25 questions
Multiplication Facts
Quiz
•
5th Grade
54 questions
Analyzing Line Graphs & Tables
Quiz
•
4th Grade
22 questions
fractions
Quiz
•
3rd Grade
15 questions
Equivalent Fractions
Quiz
•
4th Grade
18 questions
Comparing Fractions with same numerator or denominator
Quiz
•
3rd Grade
16 questions
Interpreting Line Graphs & Double Tables
Quiz
•
4th Grade