Exploring Scatter Plots and Their Applications
Interactive Video
•
Mathematics
•
6th - 8th Grade
•
Practice Problem
•
Hard
+3
Standards-aligned

Liam Anderson
FREE Resource
Standards-aligned
Read more
10 questions
Show all answers
1.
MULTIPLE CHOICE QUESTION
30 sec • 1 pt
What is a binary relation in the context of real numbers?
A mathematical formula expressing one number in terms of another
A function that maps real numbers to integers
A set of ordered pairs of real numbers
A graph showing the distribution of a single variable
Tags
CCSS.8.F.A.1
CCSS.HSF.IF.A.1
2.
MULTIPLE CHOICE QUESTION
30 sec • 1 pt
What does the domain of a binary relation represent?
The set of all possible output values
The set of all second elements in ordered pairs
The set of all first elements in ordered pairs
The total number of elements in the relation
3.
MULTIPLE CHOICE QUESTION
30 sec • 1 pt
Why are only unique values listed in the domain and range of a relation?
To simplify the calculations
Because they represent sets, which contain only unique elements
To make it easier to find correlations
To avoid confusion in graphical representation
4.
MULTIPLE CHOICE QUESTION
30 sec • 1 pt
What is the purpose of using Cartesian coordinates in graphing binary relations?
To visually represent the relationship between two quantities
To calculate the area under the curve
To solve algebraic equations
To represent complex numbers
5.
MULTIPLE CHOICE QUESTION
30 sec • 1 pt
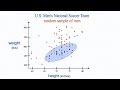
What is a scatter plot?
A graph used to plot individual data points
A type of bar graph showing frequency of data
A pie chart dividing data into sectors
A line graph showing trends over time
Tags
CCSS.8.SP.A.1
6.
MULTIPLE CHOICE QUESTION
30 sec • 1 pt
What does a trend line in a scatter plot represent?
The general direction that the data points tend to follow
The central tendency of the data
The boundary of the data set
The average value of the data points
Tags
CCSS.8.SP.A.2
7.
MULTIPLE CHOICE QUESTION
30 sec • 1 pt
What indicates a strong correlation in a scatter plot?
There are many outliers in the data
Data points are closely grouped to the trend line
Data points are widely spread from the trend line
The trend line is horizontal
Tags
CCSS.HSS.ID.B.5
Access all questions and much more by creating a free account
Create resources
Host any resource
Get auto-graded reports
Continue with Google

Continue with Email
Continue with Classlink
Continue with Clever
or continue with
Microsoft
%20(1).png)
Apple
Others
Already have an account?
Popular Resources on Wayground

7 questions
History of Valentine's Day
Interactive video
•
4th Grade
15 questions
Fractions on a Number Line
Quiz
•
3rd Grade
20 questions
Equivalent Fractions
Quiz
•
3rd Grade
25 questions
Multiplication Facts
Quiz
•
5th Grade
22 questions
fractions
Quiz
•
3rd Grade
15 questions
Valentine's Day Trivia
Quiz
•
3rd Grade
20 questions
Main Idea and Details
Quiz
•
5th Grade
20 questions
Context Clues
Quiz
•
6th Grade
Discover more resources for Mathematics
20 questions
Writing Algebraic Expressions
Quiz
•
6th Grade
20 questions
Ratios/Rates and Unit Rates
Quiz
•
6th Grade
14 questions
Volume of rectangular prisms
Quiz
•
7th Grade
20 questions
Laws of Exponents
Quiz
•
8th Grade
20 questions
Graphing Inequalities on a Number Line
Quiz
•
6th - 9th Grade
20 questions
One Step Equations
Quiz
•
6th Grade
10 questions
Solving One Step Inequalities
Quiz
•
6th Grade
15 questions
Equivalent Ratios
Quiz
•
6th Grade